


 Ok, you know how and what you are going to measure, now you need to plan how you will split them up and how many you actually need for each group!
- What are my samples? – identifying independence (avoiding pseudoreplication), what grouping will I use, where will the samples come from.
- How will I assign groups, how will I randomise? – Also think about what else needs to be randomised e.g. order for processing samples
- Measurement accuracy / variability, statistical design and sample size calculation – make your life easier with good design!
- Sample availability, ethics and budget
What are my samples? Are they truly independent?
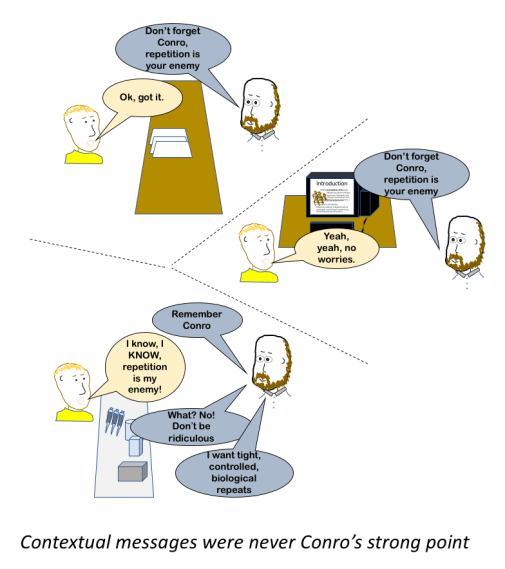
Can you recognise the difference between independent replicates and pseudoreplicates? A “sample” (your n) as far as your statistical tests go have to be truly independent.
Sometimes this is obvious; cells in the same dish, people from the same family are clearly related so aren’t independent. However, is it appropriate to consider cells in the same incubator or from the same parental flask as independent? Are study participants recruited the same school appropriate to class as independent? Ultimately the answer is dependent on what your core question is and what aspects of the shared environment could contribute to your experimental outcomes.
You base your decision on your understanding of biology and common sense. This is something that you, as the person conducting the experiment, has to do. Most statisticians will be unable to tell you whether the data from one sample has an effect on the data obtained from another. Because you are making a decision you should also be able to defend your choice so make sure you think about this at the design stage
Things to consider
- Common environment – same house, incubator, class, school, city, forest
- Shared enclosure – Same idea but worth pointing out that experimental mice/rats/rabbits that are housed in the same cage are not independent from each other e.g. if you stress one, the others in the cage will respond to that stress
- Relatedness – At all levels, parent/offspring, cell/parental plate
Often scientists talk about biological replicates and technical replicates/repeats. Biological replicates are your independent samples; usually they come from how many times you did the whole experiment or each separate patient donor/animal. Technical replicates, in contrast, are the individual measurements you make from each biological experiment (e.g. the biol repeat might be the dish of cells, the tech repeat is the measurement from each cell). Technical replicates are included to give you confidence in the values you get from your biological repeats.
Key point – identifying what will count as a biological repeats and how many technical replicates you need per biological repeat is important for your statistical design and could save you time and money.
Example. You perform a scratch wound assay comparing two treatment groups. You set up the a plate where 12 wells will get treatment A and 12 wells treatment B. You scratch each well and make 3 measurement along the scratch at the beginning and end of your assay i.e. 36 total measurements per treatment group. Is your sample size 36, 12 or 1? The answer is almost always 1. This means that you gain a single value from this experiment as far as your statistical test (likely a t test for this set up).
The 36 measurements in the example are used to generate the one value that you take forward to your final analysis. If the drugs/cells are expensive/precious or it takes a long time to analyse each image you might have got almost as robust data using less measurements per experiment e.g. using 3 wells per treatment instead of 12. Your pilot study will tell you how much variability to expect between technical repeats and help you make this decision.
Key point – Performing measurements through time? Remember to consider wash-out periods
Paired analyses has advantages in terms of statistical power however, you have to consider whether enough time will have passed between measurements for the earlier effects to have passed. These can be particularly important in human experiments where psychological/psychosomatic effects can and will persist and may influence the subsequent measurements.
How will I assign groups, how will I randomise?
OK, you know what you are comparing, what your different groups are going to be, now you need to think about how participants/samples/cells/treatments will be assigned between those groups. There are many different ways to do this ranging from fully randomised (from a random number generator) to stratified in different ways prior to randomisation e.g. splitting the population by gender before assigning groups so that each group has the same male to female ratio.
Key point – You should be able defend your grouping/order decisions against the harshest critic
Group assignment isn’t a trivial decision. There are lots of primary data papers on which randomisation technique you should be using (eg this one). Remember that whatever you decide must get reported in your methods section and you may need to provide the justification behind your choice.
Key point – you also need to consider the order, timing of sample processing
A similar message to the measurements through time comment above, whenever you can randomise the order in which measurements are taken or interventions taken, you should! If you are conducting a paired analysis comparing responses of the same individual to two different things you should randomise your study population so that half receive treatment 1 first, while the other half receive treatment 2.
Bench Scientists Beware! Randomisation isn’t just for people/animal studies you should be randomising in your bench science experiments too. I see problems with this an awful lot in the lab, there is a tendency to do the negative control first, positive control second, and treatment groups in position 3, 4, 5 etc every time they do their experiment. While this set-up may be easier in terms of repetition, and it might feel like a logical thing to do, it raises questions about whether the order you treat the samples or their relative location in the dish for example has an influence on the outcome.
Before you brush this off remember that location effects are a thing! For example, wells around the edges of multiwell plates frequently show different results from internal ones (here is a handy article on designing out edge effect). Most people who have worked in the lab are aware of things like this; failing to take it into account could invalidate all your findings.
No excuse not to randomise. There are lots of random number generators available online. This one is quite good and aimed at lab research – https://www.randomizer.org/
Measurement accuracy / variability, statistical design and sample size calculation
Before you start your experiment you should have a good idea what statistical test you will perform. The better your design, the simpler your stats will be! Deciding which to use is a whole course on its own so I won’t go too deep here. If you have followed my previous advice regarding simplifying comparison groups then you likely will be able to use some of the more standard tests that you learned about in school! I’ll point some of those out here so you can check what to look up
Some common tests: Key: outcome variables are what you measure, factor variables are how your samples are grouped/distributed. Categorical means discrete answers (yes/no, small/medium/large etc), continuous means the numbers can be anything (things like time, speed, height, age etc), sometimes it is appropriate to break continuous measurements into categories (aged 0-5, 6-10 etc).
- Chi-squared – outcome variables and factor variables are both categorical
- T tests – outcome variable is continuous, factor variable is categorical – use when you have two groups.
- Independent – samples in group 1 are unrelated to group 2
- Paired – measured each sample twice eg before/after or treatment A/treatment B
- ANOVA – outcome variable is continuous, factor variables are categorical -e.g. treatment A vs control treatment group vs untreated. Note single outcome measurement
- 1 Way – similar to independent t test except accounts for multiple groups.
- 1 way repeated measures ANOVA – similar to paired t test
- Pearson Correlation/Regression – continuous outcome variable, continuous factor variable
- Logistic Regression – categorical/binary outcome variable, continuous factor.
- MANOVA – multiple outcome variables, categorical factor variables (e.g. if you were comparing the effects of a treatment to controls on more multiple different genes/miRNAs/proteins).
For those people who are well versed in stats you will have noticed two thing in this list i) these tests all assume normally distributed data and ii) this is a very incomplete list!
Regarding point i) when it comes to the design aspect of an experiment and determining sample size, I would assume that the data will be normally distributed unless I have reason to think it won’t be. Be aware, that after you acquire the data you will test for normality and may have to change test.
Regarding point ii) if your set up won’t fit into any of these commonly used approaches you definitely should get input from a statistician before you start! I would recommend getting a statisticians help anyway!!
Hopefully now you have identified what stats test you think you will need, the next step is to calculate how many samples you need.
Don’t be put off. There are online calculators for sample size and power analyses!
I quite like; http://www.powerandsamplesize.com/
Key Point: if you underpower your experiment it might not have been worth doing the experiment at all.
Most of the time you will need four values for to calculate sample size:
- The size of the difference you want/expect to see (difference between populations)
- The variability/error between each biological sample
- The p value (α)- how confident do you want to be that differences between populations are real? (or, more accurately, what false positive rate are your prepared to accept – type 1 error)
- The power (1-β)- how confident do you want to be that two populations are not different? (or what false negative rate are you prepared to accept – type 2 error).
For size difference and variability these data will usually come from your pilot study data, however, you might be able to estimate these values from published studies of similar experiments.
Key point – Don’t forget to think about biological implications of the difference you are looking for when making your sample size calculation
Consider the biological significance of the difference you are looking for. For example, I could design an experiment that would be able to statistically detect a 2% increase in cell migration rates by having a massive sample size, but a difference that small might have no noticeable impact on wound closure rates so it might not be interesting anyway.
For p value and power, the decision is yours and will depend on the experiment. p<0.05 and power of 80% are very commonly used but you should acknowledge here that these are arbitrary numbers and it might be more appropriate to design your experiment around different thresholds, especially if you plan to exploit the findings in a clinical environment or you might choose to accept lower values in a exploratory study. You will have to justify your choice at some point: an answer of “that’s what everyone does” isn’t likely to impress.

Sample availability, ethics and budget
By this point you know what you need in terms of numbers but before you commit you need to decide if those numbers are actually viable. Three questions:
- Can you acquire enough samples / is it practically possible to get enough samples? e.g. is doing 3000 independent tissue culture experiments truly going to be possible
- Is it ethically appropriate to do the experiment as planned, can you justify the number of animals or donors you need to get your results?
- Can you afford it? How much does each sample cost, do you have the funding you need?
If the answer is no to any of these you might need to redesign aspects of your study (or apply for more funding!).
Happy with with all these questions? You’re almost ready to go, on to finishing
