

Writing your results effectively can maximise the impact of your findings and help you get your message across. The results section ultimately will become one of the parts of your paper/chapter that you will find the easiest to write, but, from my experience, it’s also an area that early in your career you need help to make the most of. In particular, it’s an area where students frequently unnecessarily lose marks in assessed work! This guide will, hopefully, help you decide the best way to write-up results of your experiments. In it I’ll talk about some of the optional elements you can choose to include, where they can be useful, and have included some examples of times I have used these things in my work.
The guide on this page is quite comprehensive and will be better for you in the long-term. However, I wrote a much shorter post about this awhile ago that could help if you are in a rush! here. There is also a guide to writing discussions here.

Decisions? Options? Surely, you’re supposed to just write down the results?
Yes, that is the simplest option. However, you can do more than that. You can use the results section to help deliver the narrative to the whole story, i.e. you can make it more enjoyable or accessible for the reader + the numbers alone might not make sense!
You can also use the results section to help shape what the reader thinks about of your data, guide them to interpret the data in the way you want them to.
Hopefully you have read lots of papers by this point but likely, you didn’t really notice how exactly each results section was constructed. I recommend pulling out a few papers that you enjoyed to read alongside this guide so you can see how they put these ideas into practice.
The big decision… What is your story?
Often the answer to this is obvious, especially if you are writing a small, linear study which is most likely for short project reports such as MRes or undegrads. However, as you progress in your scientific career you are much more likely to have a series of experiments that you could combine together in a variety of different ways. So, how do you decide how to combine the different individual elements into a cohesive story? I am assuming at this point, you have processed the data and made at least version 1 of your figures!
Think about what each part contributes to the main point you want your overall paper to deliver. Think about what the rationale behind each section is; does one set of data inform another?
Whenever I am unsure about which order is best I have a “jig-sawing” session. I print out then cut up the figures so that I have the data from one experiment each on a separate piece of my “jigsaw”. I then play with assembling the pieces in different ways, saying out loud how I would explain the flow from one piece to the next if I were presenting it to an audience. I actually find this really useful not only for planning the writing of a manuscript but also for identifying holes in the story; i.e. the next experiment, so do it at various stages as the work develops.
Particularly if you are writing a manuscript that you plan to submit to a journal, you should also consider what the readership of the journal are used to seeing, and what they are more likely to be interested in.
What goes in your results subsections?
OK, you have got your core structure. Next you break it up into accessible pieces. The “accessible” part is important; breaking up your data will help your reader digest it. Like a paragraph, each subsection should deliver a key point fully but not try to do too much. Too small a subsection will be disruptive rather than beneficial.
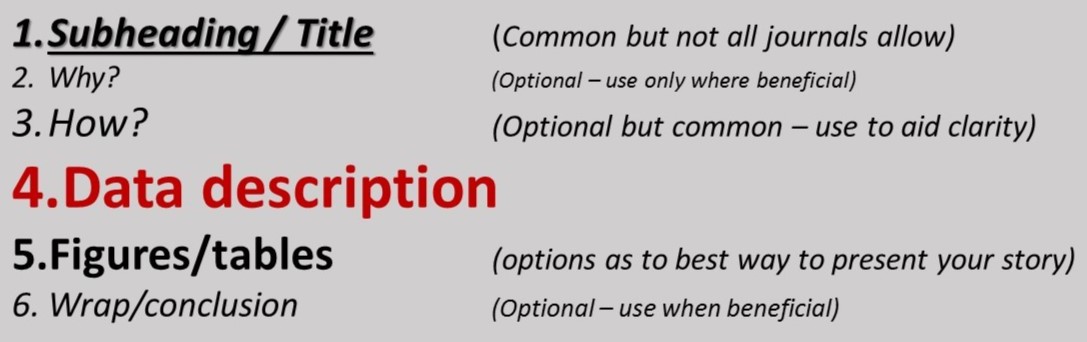
A subsection can contain up to 6 elements, I’ll discuss each in turn.
- A subsection title (usually)
- *A “why” sentence (rarely – where it can add value)
- *A “how” sentence (usually)
- The results of the experiments in prose form (always)
- The data figures that illustrate your data. (always)
- *A wrap sentence (rarely – where it can add value)
What to include and what not to, depends on your story, what your supervisor’s preferred style is, and what is “normal” for the journal or the field you are writing for. So get some similar papers in your target journal and look to see what was done. As you’ll see below as I expand on these you might not always use every part in every subsection.

Subheadings,
Make them work for your data.
OK, you have got your core structure. Next you break it up into accessible pieces. The “accessible” part is important; breaking up your data will help your reader digest it. Like a paragraph, each subsection should deliver a key point fully but not try and do too much. Too small a subsection will be disruptive rather than beneficial.
Most journals allow you to use subheadings to break up your prose. These can really help your story. You can use subheadings in three different ways:
- Simple signpost.
- Objective signpost
- Results title
The simple signpost helps the reader find a subsection they are lo oking for. Something like a statement of what the technique is being used for that section of the findings. Note that these sorts of minimalist subheadings don’t add much value so I personally recommend using them only for simple studies where all the parts contribute to the same question. However, they can be all you need and minimalist approaches are sometimes best. You are likely to see these type of subheadings in materials type papers, for example this recent work from Victoria Kearns (Kearns J Mater Sci Mater Med. 2017; 28(8): 124.)
Objective signposts are slightly better signposts! They let the reader know why you did a set of experiments. What the question was (though don’t phrase them as a question). Even if you prefer the results statement type, these are the still the sort of heading you will use when you need to describe a new experimental tool or the model system i.e. where you aren’t testing a hypothesis but need the section to advance the story. Other times you will see objective signposts is when the authors are describing multiple tests on a single thing, where the core hypothesis doesn’t evolve (such as this study on a new contact lens by Gallagher et al). You are more likely to see these in medical and engineering type articles.
For option 3, the results statement, you state the answer to the question your experiment asked. Each of these is like a title of a short paper. This is an opportunity to show what your data means; it’s a chance to set up your key discussion points or advance the story. If you are writing a student paper or thesis, this is an
early chance to let your examiner know that you understand your study! Indeed, if I am marking a piece and a student has used an objective signpost when a result statement would have been better then I assume that they haven’t thought about or understood what their results mean!
In case you haven’t guessed, the results statement is my preferred style and is what I would expect to see in most molecular biology type studies. Note your work doesn’t have to be complex for you to use this approach (for example, we used results statements in our sunscreen study recently which was a very simple project).
Usually you will use a combination of styles; objective signposts for tools development, results statements for the data part (see diagram near the end of the page for how manuscripts can be assembled). There are lots of examples out there, have a look at this paper that I wrote a couple of years ago. for an example of mixed subheadings styles for different parts of the story.

2. “Why” or link sentences/clauses (optional)
Connect you story
Sometimes, but not always, you might want to set up the next set of experimental data by including a “why” sentence or clause. These are used to move the story forward, linking sections, and/or explain to the reader the thought process that led you to the next set of studies and to flag the relevant literature. “Why” sentences can also help readers to follow the story you are telling. Generally this benefits more junior readers the most, but remember you want your work to be understood by as many people as possible so consider using “why” sentences whenever they help you tell the story.
Example “why” sentences might be as simple as “Next we tested the hypothesis that…” but you can go deeper, connecting to previous studies or earlier data; “Our data raised the possibility that…… and previously it have been demonstrated that ….. (ref), therefore to test this….”
 “Why” sentences are usually most effective when your story evolves through the course of your paper for example when your first sets of observations have raised new questions that you want to make clear to the reader before you describe the next set of data you have obtained.
Be aware that some authors never use why sentences, so don’t be surprised if your supervisor removes them from your draft! Similarly, be aware that you shouldn’t make the results longer than it needs to be, so you should only include a “why” sentence when it actually serves a purpose, where it helps the story.
You probably won’t need a “why” sentence in your first couple of subsections as you really should have established your main aim/hypotheses in your introduction. If you are using objective subsections you probably won’t need “why” sentences either as you are already telling the reader what you are trying to test.
3. “How” sentences/clauses (optional)
Remove ambiguity
Your materials and methods section contains the extensive details of how your experiments were performed so why would you need a “how” sentence in your results? Well, the “how” sentences are usually in there to help the reader; either as a reminder or as a way to remove ambiguity.
If you are writing a thesis chapter, the how sentence might mean your examiner doesn’t have to flip back through 50 pages or more to find out where your data came from. In a manuscript, many readers will read the results before reading any methods so writing the “how” sentences will mean that they enjoy reading your paper more.
Most “How” sentences are really simple, a clause within a sentence, and just serve as a flag to the reader for which section of methods to refer to. You likely won’t need a “how” sentence if the methods are explicit in the subsection title. However, they can be used to remove ambiguity if the sort of data can be obtained in multiple different ways. Remember the deep details are in the methods to just use the bare minimum to allow the data to be appreciated.
 If you feel that the description of your data would benefit from a diagram of the experimental set up, then the “how” sentence is a way for you to include that figure reference in the right place in your story (putting the diagram beside the data that comes from it is usually the most effective).
Within large subsections, the “how” sentences or clauses help connect the different parts, eg if you ask the same question in different ways you would use how sentences to link them.
I almost always use some form of “how” statement in my work, the only time I wouldn’t if I was writing some very short format and simple paper.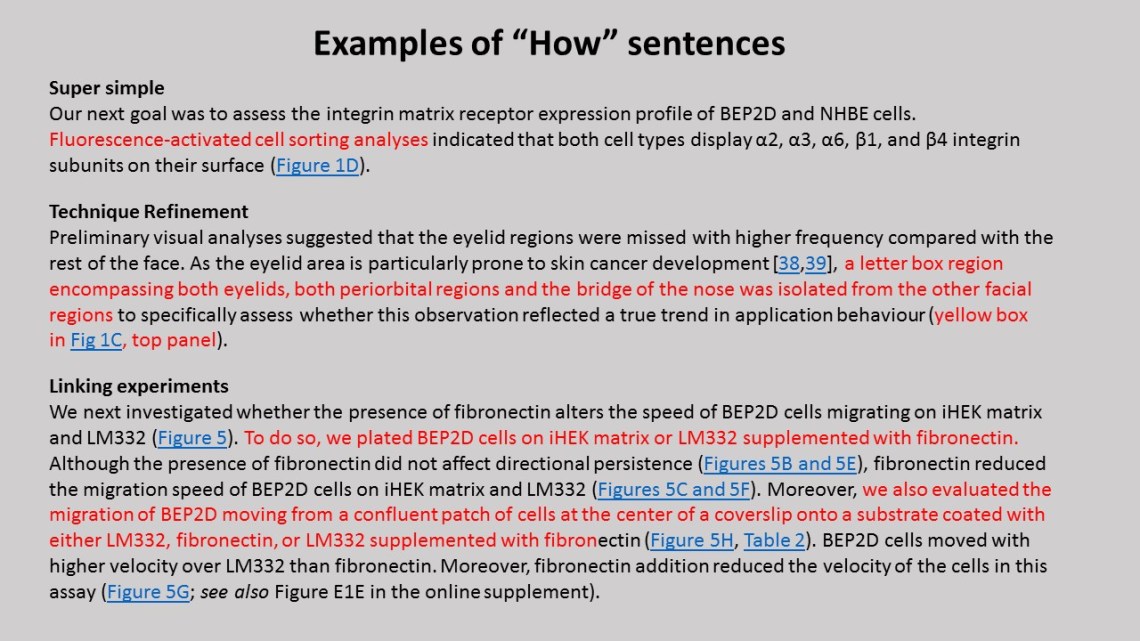
4. Data description
Tell me the answer!

This is it guys. This is why the person has come to read this section of your work. They almost certainly will have read your abstract and will have most likely at least skimmed your figures (I usually go straight to the figures). So here is where you actually tell the reader the results in clear, definitive terms.
A dry statement of just the numbers is hard to read… so, tell the story of your data
- Arrange your sentences to focus the message on the biological significance.
- Don’t only tell the reader that two populations are statistically different tell them the direction and magnitude of the differences (X was 3x bigger than Y).
- Provide the actual numbers, p values or power from statistical tests.
- Use the appropriate descriptions of the populations eg means and standard deviations for normally distributed data, median and interquartile ranges if non normal.
- Make sure you use appropriate number of significant figures.
- Check the descriptions are clear, succinct but complete.
- Remember to reference every figure panel including any supplemental figures. Make sure to reference figure panels in the order they are in the figure 1B before 1C etc (change the figure if necessary to suit the flow of the story).
- Don’t repeat data that is presented elsewhere (eg in a table) but do provide the actual numbers for things you have presented graphically.
5. Data figures
These are really important. The figures are the evidence that supports your data.
They are so important that I will write a separate guide for these and link to it here in the near future.
For now, remember that the figures are the evidence but your story should be fully understandable without having to look at the figures at all. So, write your results assuming that the person reading isn’t looking at the figs!
On this basis, I prefer to see sentences like “the data revealed…….. (Figure 1C)” rather than “As shown in Figure 1C, the data revealed ……”. Using the former, you focus the sentence on the story rather than on the figure location.
6. Wrap (optional)
“These data demonstrate ……..”
Sentences like these sometimes help to reinforce your message or clarify a complex set of disparate data. It’s another chance to hammer home your interpretation of the data. I also sometimes use a wrap to reassure the reader that I have addressed some concerns that they might have had.
Note; most of the time If you used a “Results statement” type sub-heading you usually don’t need a wrap as well.
Putting it together
Just to re-emphasize, you won’t necessarily use every component in every results subsection. It all depends on what is needed to advance your story. Don’t make it longer than it needs to be – you’ll lose your reader that way too!
 Most of my work has involved an initial hypothesis and to test that we needed to develop a tool. We then used those tools and got some initial results. Those results lead us to new questions, for which we needed new tools and then we used those tools to test our deeper questions. An example of how that paper would be assembled is in the fig below. You can also see real world versions of this here, here, and here

Final comments
Develop your own style
As you read papers think about what you’ve read here. What works well? What is too much? What isn’t enough? You’ll soon make your own opinions about what is best.
Get feedback on your writing. Get your colleagues to read it. A well written results section shouldn’t need specialist knowledge to be understood.
The more you write, the easier it becomes.
This is part of a growing series of guides… you can find the rest here
A quick thank you to finish; my postdoctoral training was with Jonathan Jones. I really enjoyed reading Jonathan’s papers as a PhD student, not only was it important, seminal work but also the findings were delivered in an accessible way. If you want more examples of how to write effectively, check out some of his work. Working in his lab and getting his feedback on my drafts gave me the opportunity to develop my writing style. A true mentor, JJ shaped the way I think about science and helped me communicate it more effectively.
Any comments?


About the author

Dr Kevin Hamill is a Senior Lecturer in Cell and Molecular Biology at the University of Liverpool, in the Department of Eye and Vision Science, Institute of Ageing and Chronic Disease. His lab focuses on cell-matrix interactions; you can read about ongoing work elsewhere on this blog, the lab webpages, or published work. As well as supervising PhD, Masters in Research and Undergraduate research projects, Kevin is the academic lead for the Lab skills Module of MRes Clinical Sciences program where he teaches fundamental skills for life scientists.
Like the cartoons on this page? Have a look at the blog for “life in the laminin lab” our new lab comics


6 Comments