This lab skills multiple choice quiz is part of a series of MCQs that are designed to help teach core skills including protein and DNA analysis techniques . The questions in this page all refer to a single figure taken from a published paper. The real information provides a way highlight concepts relating to data interpretation, experimental design, data processing and presentation in a real-world context. If you want a simpler challenge try one of the other quizzes first. . My plan is to add some more quizzes like this one in the future. bookmark this page or follow the blog to stay updated.
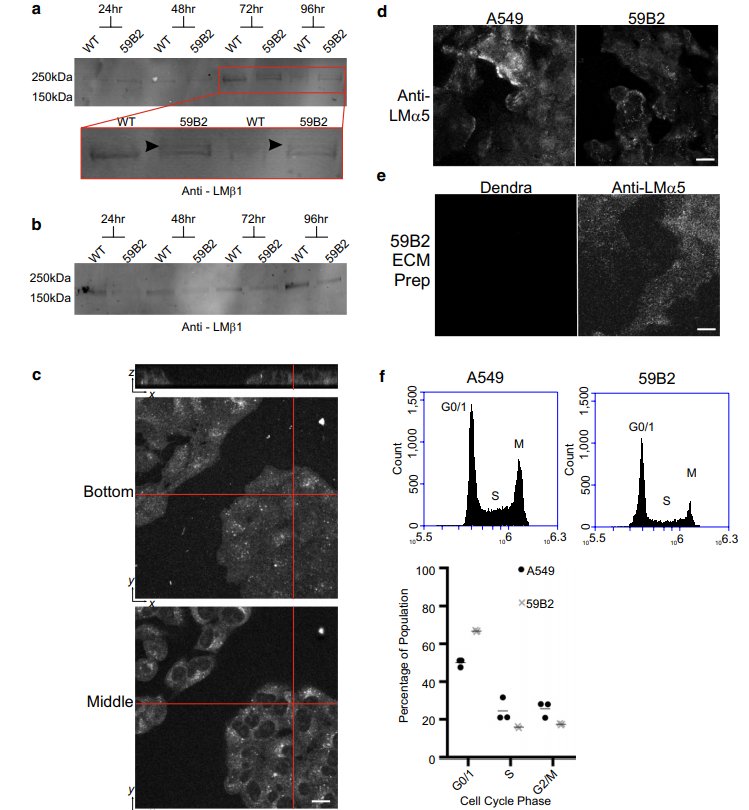
In this figure we have western blot images in panels a and b, fluorescence and immunofluorescence microscopy images in c, d and e and flow cytometry analyses of cell cycle in f. We will get into the details of what is going on as we progress through the questions below.
The blots in panel a and b have been probed with anti-laminin b1 antibodies. They are standard western blots using a denaturing buffer, SDS-PAGE and transferring to a nitrocellulose membrane.
In panel a, the little arrowheads are pointing to a faint band in the 59B2 samples that are not present in the WT samples Based on these data along, what are the potential explanations for this difference? There are FOUR correct answers.
59B2 cells are produced two versions of the laminin b1 protein, with the extra band being a slightly larger version.
Yes, as simple as that. Indeed, that was the whole point of this blot. The 59B2 cells were modified forms of the WT cells. In the 59B2, CRISPR had been used to add a tag onto the C-terminus of the gene. That tag meant that laminin b1 was ~26kDa larger than usual. The 59B2 cells were heterozygous for the tag and therefore express one copy of the longer form and one copy of the short form.
There are post-translational modifications to laminin b1 (such as glycosylation) that happens in the 59B2 cells extracts but not the WT cells.
This is an option. The laminin b1 protein is slightly larger in the 59B2 extract, therefore it is possible that something has been added to the protein. The modification is quite big here, beyond the size you would see of a phosphate or hydroxyl group addition, but a big sugar addition could cause this sort of size shift
The laminin b1 has been proteolytically processed in the WT cell extracts but only partially processed in the 59B2 extracts.
Yes, this could explain why all the WT laminin b1 is the small form and only some of the protein is the smaller form in the 59B2. Differences in processing could reflect different levels of activity of proteolytic enzymes or different folding of the parent protein.
The protein extract from the 59B2 cells has been partially degraded.
This is unlikely to be the answer. Partial degradation would lead to additional bands BUT those bands would be of lower molecular weight and would be lower down the gel rather than higher up.
The laminin b1 has been proteolytically processed in the 59B2 cell extracts but only partially processed in the WT extracts.
If you have ever done a MCQ before, you will realise that if this one is wrong, the opposite is probably correct. Give it a go and see if I am being sneaky!
The 59B2 cells are producing an additional form of the protein with lower pH
In a SDS-PAGE we separate proteins based on size. In a standard denaturing buffer, the use of SDS means that all proteins obtain a negative charge that is proportional to their length, irrespective of their pH. Note, It is possible to separate proteins based on pH. Traditionally this is the first step of a 2D gel, can you think why you might want to do that?
Some cells produce a long form of laminin b1 and some cells produce a short form. In 59B2 there is a mixed population whereas in WT there are only cell type
Yes this could explain these findings. Can you think of a technique that could be used to determine if this is the case? (it’s not necessarily easy and might take developing a new antibodies or doing some lengthy cell culture processes first)
Nice quick one. What percentage gel do you think was used for the blots in a and b?
7.5 %
Yes, high MWT proteins need low % gels to be able to resolve the small size difference visible here
10 %
12.5 %
15 %
30 %
This will be really thick! I’m not convince anything would enter the gel
In panel C the fluorescent images come from the Dendra2 fluorescent tag appended to the C terminus of laminin b1.
In panel D, the signal comes from antibodies against laminin a5 that have been detected with a fluorescently conjugated secondary antibodies.
In E, the two images are of the same region on a dish imaged both for Dendra2 and for laminin a5.
Dendra2 is an unusual fluorophore – it normal is excited by blue light and emits green. However, if you excite it using a violet laser you cause a permanent photo conversion so that the protein now is excited and emits in the red part of the spectrum
Based on this information, what fluorophore was used to detect laminin a5 in these images?
Cy5.5 – Ex 650 nm Em 694 nm.
Yes, this is a far red fluorophore – choosing this would reduce potential of either photoconverting the dendra2 (<300 nm) or collecting signal from either in its green (488) or red form (550) forms. Using far red is a bit of a pain – you can't see it with your own eyes down the scope – but avoiding spectral overlap reduces the possibility for bleed-through. Note that controls were still run to confirm this!! (not shown here)
Alexa Fluor Ex 594 Em 617
TRITC Ex 547 Em 572
Fluoroscein FITC Ex 495 Em 518
Hydroxycoumarin Ex 325 Em 386
Panel f shows two flow cytometry plots where cells have been stained then their fluorescent intensity of the stain measured to determine what stage of the cell cycle they are in. Which of the following stain has been used?
Propidium Iodide (DNA)
Yes. PI binds to DNA by intercalating between the bases with little or no sequence preference, The more DNA, the more signal. Therefore the cells in M phase will have twice as much as those in G0/G1 and S phase in between amounts depending on how far through the process of DNA replication the cells have progressed.
Cell-light-GFP Peroxisome label
Nope – why would knowing how much peroxisome fluorescence tell you which stage of the cell cycle cells are in?
BODIPY FL C5-Ceramide (Golgi complex)
Nope – why would knowing how much golgi fluorescence tell you which stage of the cell cycle cells are in?
CD4 (Geoffrey)
Dendra2 (fluorophore on laminin b1)
This would tell you how much of the tagged protein was expressed in each cell. For the WT cells this should be just background whereas the 59B2 should have signal above that background. It wouldn’t tell you the cell cycle of either populations of cells unless there was a direct link between protein expression and cell cycle stage.
You might recognise this figure, it includes images laminins. Probably the most interesting protein in the world. Want to know more?This post describes the rest of this paper in short form.