


 Which, of the following protocols, were used to generate this image?
 Cells were plated on coverslips, 24 hours later cells were fixed and permeabilized, then probed with antibodies against two different proteins. Those antibodies were washed off and then secondary antibodies with two different coloured fluorophores were added, coverslips were mounted onto slides and imaged using a confocal microscope
Thin sections were cut through a tissue and mounted onto a slide. Two different coloured chemical stains were added overnight, unbound stain was then washed off and the slide was imaged using an epifluorescent microscope
A mouse eye was opened along its equator, the vitreous removed, and an antibody solution added directly to the retina. After 24 hours, the retina was cut along its corners and spread onto a slide. It was then imaged with a 100x objective on an upright microscope
Live cells induced to express a green protein and purple protein via adenoviral transduction were imaged using phase contrast microscopy on an inverted microscope equipped with incubation chamber.
Phase contrast microscopy doesn’t allow you to see fluorescence
To test which of the following hypotheses would transmission electron microscopy be an appropriate imaging modality?
The inner plaque of hemidesmosomes does not assemble in mouse epithelial cells lacking kindlin-1
electron microscopy allows you to obtain high-resolution structural information, for this hypothesis you would image the two cell types and compare the “inner plaque” of the hemidesmosome.
The stiffness of endothelial basement membranes increase in line with the relative abundance of perlecan in the matrix
TEM isn’t used for stiffness measurements, perhaps atomic force microscopy could allow you to test this hypothesis.
Surface topography of lactic acid bacteria grown in soy sauce differs from those grown in brown sauce
For topography, you would be better going for a scanning electron microscope approach
Treatment of limbal epithelial cells with gold nanoparticles coated with short interfering RNA targeting pax6 lead to decrease in pax6 mRNA levels
For this hypothesis you would measure RNA levels, most likely by qRT-PCR. If you were desperate to use a microscopy technique, then in situ hybridisation would be an option but this could be difficult to do quantitatively in this context.
You are comparing two different coverslips that have been fixed and processed for indirect immunofluorescence microscopy with the same antibodies. What can you determine?
Relative protein location (eg nuclear in slide 1, cytoplasmic in slide 2)
Relative protein quantification (e.g. higher expression in slide 1 than slide 2)
Although you could quantify staining intensity, this sort of technique is actually really bad for this type of quantification – no clear linear range, lots of bleaching, variability in processing; lots of people do this but it’s really unreliable and should be avoided! If you want to quantify proteins, use an ELISA, a western blot or some other quantification method
Protein location and quantification
Location yes, quantification not very well! Although you could quantify staining intensity, this sort of technique is actually really bad for this type of quantification – no clear linear range, lots of bleaching, variability in processing; lots of people do this but it’s really unreliable and should be avoided! If you want to quantify proteins, use an ELISA, a western blot or some other quantification method
Protein dynamics (eg protein in slide 1 is moving faster than protein in slide 2)
You would need fixed cells and tagged proteins for this sort of analysis.
Which light exposure conditions would be most harmful to live cells?
600 nm (yellow) light, 200 ms exposure
700 nm (red) light, 160 ms exposure
white light, 5 ms exposure
450 nm (blue) light, 200 ms exposure.
shorter wavelengths carry more energy that longer wavelengths. Although white light contains short and long wavelengths, once you account for shorter exposure times the damage is less. If you are planning a live imaging experiment, you should take this into account when deciding how long/how frequently to image.
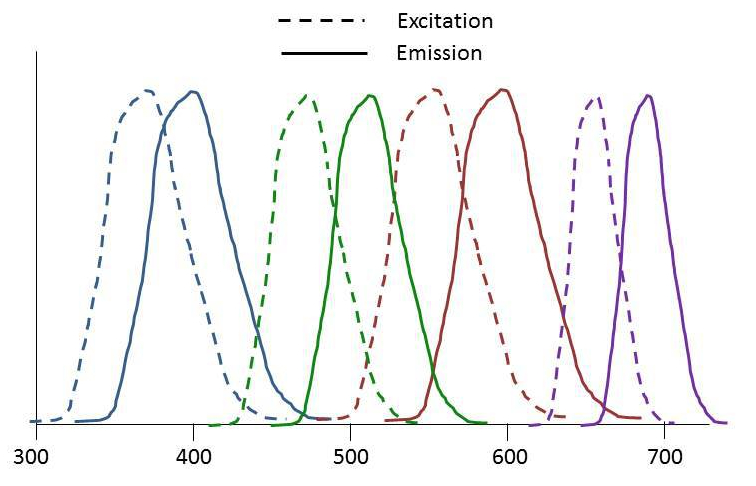
You want to investigate the relative distribution of four proteins in your samples. You check the lab stocks of secondary antibodies and obtain the excitation/emission spectra of four abs that look like they work (above). Your next question, is which microscope would work for this experiment?
Confocal microscope with 405nm, 488nm, 543nm and 650nm laser lines and the following band pass (BP) filters: BP380-450, BP400-550, BP500-600, BP500-700, BP600-700 and long pass filter (LP): LP600, LP700
With this set up you could image sequentially: for blue, excite with 405nn, BP380-450 will cut out any green light, for green excite with 488nm, BP400-550, although you will get a little bit of red excitation with the laser, you will cut out the red emission with the filter. red excite 543nm BP500-600 will excite a little green/purple but the band pass cuts out the emission from those fluorophores, purple excite 650nm, LP700 again this will cut the red emission.
It’s not possible, the spectra overlap.
it is possible! Try again.
Epifluorescent microscope with band pass (BP) filters: BP380-480, BP400-580, BP500-650, BP550-700, BP600-700 and long pass filter (LP): LP600, LP730
Using this scope you are relying on the filters to cut out the emission from the wrong fluorophore. the BP380-480 will be OK for blue, but the BP400-580 will not only get green light but also some blue and some red. i.e. even when you want to look at red, you can’t be sure you don’t also have green. Note shorter range filters exist, these numbers are just made up! How you will image your samples is something you should be considering during your design stage of these experiments.
Confocal microscope with 405nm, 500nm, 562nm and 720 nm laser lines and the following band pass (BP) filters: BP380-450, BP400-550, BP500-600, BP500-700, BP600-700 and long pass filter (LP): LP600, LP800
this won’t work for you as you won’t be able to excite the purple fluorophore

Fluorescence resonance energy transfer (FRET) uses the light emitted from one fluorophore (donor) to excite the next fluorophore (acceptor). Which of the following fluorophores would be the best FRET pair?
Donor: green. Acceptor: red
there is a decent amount of overlap between the emission curve of green and the excitation curve of red. There are better FRET pairs than this, but it could work.
Donor: red Acceptor: green
FRET only works if the donor is shorter wavelength than the acceptor, remember the emitted light is longer than the excitation (Stokes’ shift)
Donor: blue Acceptor: green
there is very little overlap here, you might get a little FRET but it wouldn’t be very good.
Donor: red Acceptor: purple
there is very little overlap here, you might get a little FRET but it wouldn’t be very good.
Donor: green Acceptor: purple
there is no overlap here, you wouldn’t get any FRET
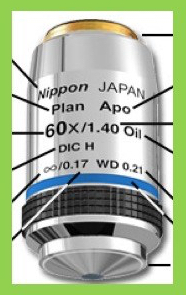
Which objective would allow you to obtain the highest resolution images?

Nope… what is the feature of a lens that determines the resolution? This objective is actually an extra long working distance, you would use this for imaging through thick substrates but often you have to compromise in terms of resolution or sensitivity.

Yes, numerical aperture determines the cone of light that enters the lens, the higher the better.
Try again.

No, not this one… have another go.
 Your images have issues with uneven illumination… which part of the microscope should you adjust?
Part B: the condenser
Yes! Learn how to adjust this to make sure you get even illumination for your phase contrast optics
Part C: the stage.
adjusting the stage will change the focus. Here the sample is in focus across the image, the issue is how the light is illuminating it
Part D: the objective turret
this is unlikely to be where the issue is here, usually if there is an issue with the way the objectives are mounted you will have focus issues or no image
Part A: the diaphragm/light source
You will close the diaphragm to help you fix the problem, however this isn’t the part you will adjust
What is photobleaching?
When a fluorophore reacts with a biological compound in a reaction catalysed by photons.
When light energy reacts with a fluorophore and causes permanent structural damage.
Yes, this is why your samples will fade as you image them. This feature of fluorophores and fluorescent proteins can be used to your advantage: in the techniques FRAP and FLIP. FRAP – fluorescence recovery after photobleaching – can be used to measure the rate at which turnover occurs within a complex. FLIP – flourescence loss in photobleaching – can be used to ask similar questions but usually is more focused on whether there are distinct populations of protein e.g. pop 1 assembled into an adhesion complex and pop 2 in the cytoplasm
Where a biological compound interferes with a light source to prevent flourophore oxidation.
Nitrates within a solution react after exposure to light to produce a stable molecule that sequesters the fluorophore.
 How could this figure be improved? There are two correct answers here. (image from this paper)
 Replace the letter labelling with an indication of the antibodies used.
Yes, the information is in the figure legend however, the reader shouldn’t have to read the legend to understand the figure and simply improving the labelling would help
Fix the alignment of the panels.
Yes, seems obvious but this sort of sloppiness takes seconds to fix so why choose for it not to be right?
The purple background should be white
I agree with you, however, this is a style decision by the journal rather than the author! When the figure was prepared it would have been on a white background!
There should be black boxes around each image
If that helps they should be there but it isn’t really necessary
The images should be in a different colour scheme (ideally black and white)
These type of images are typically taken using a colour camera, it is usual to show them in the colour they were captured in. The white balance of the camera could perhaps have been adjusted but the colour scheme is OK.
In the video above, corneal epithelial cells have been induced to express the focal contact protein paxillin with a green fluorescent protein tag (GFP). What advantages and disadvantages of this approach in comparison to using antibody staining? Pick one advantage and one disadvantage.
Advantage: We can answer questions relating to protein dynamics e.g. comparing focal contact assembly or turnover rates
Advantage: We can obtain higher resolution images
At present, superresolution microscopy requires fluorophores that “blink”, a GFP conjugate will give a steady signal and so we won’t gain resolution here compared with antibody approaches
Advantage: Our samples will keep for longer in storage
in live imaging you are using a protein to generate your signal, this protein will degrade over time and therefore will fade. Antibody stains will fade too but there are a number of anti-fade reagents that mean that processed slides can kept for longer without dramatic reductions in signal. Simple message; if you are doing tagged protein work, make sure to image as soon as possible
Disadvantage: The fluorescent tag or expression system could affect protein localisation or function
this is always something to have in mind, we’ll have a look at how to control for this issue in the next question.
Disadvantage: You will only be able to observe live cells using this technique
No, you can fix your fluorescent protein expressing cells and then image them afterward.
Disadvantage: Only one protein can be studied at a time using live imaging
No, you could introduce another fluorescent protein eg with red (tdTomato, mCherry), yellow (YFP), blue (BFP) or other tags. The entire visible spectrum as well as far reds are covered. You could also combine fluorescent protein with dyes and antibody staining as required.
You want to use your paxillin-GFP construct to compare focal contact turnover in cells derived from patients with a skin fragility disorder compared with cells from people without the disorder. Which of the following treatments/alternative experiment/samples would help you be convinced that the results obtained can really be interpreted as a relating to focal contact turnover?
Perform a similar experiment with another focal contact protein with a colour tag e.g. talin RFP.
Yes, this would increase your confidence that it isn’t a paxillin specific effect but rather more generally associated with focal contact turnover. There is another correct answer in this list, have you identified it already?
Cells expressing GFP only
You almost certainly should run this control. It allows you to see the effect of the GFP on the cells and you would infer from this that the difference in effect between this and the paxillin GFP is due to the paxillin. However, this wouldn’t help you know if the paxillin is assembled into focal contacts or some other cellular structure. Remember to design your controls to match your question
Increase the number of patients from which you have taken samples
Increasing experimental “n” will increase your confidence about the generalisability of your finding. You will need more samples to generate the numbers required for statistical interpretation. However, increasing n won’t in itself add depth to the experimental interpretation, rather you will be confident that what you have observed is real (this is important too!)
Fix the cells at the end of the experiment and stain for focal contact proteins
This would allow you to confirm that the GFP signal you have been tracking is (at least at the end of the experiment) associated with focal contacts. It’s not perfect by any means, but it would be quick and simple to do and would increase the confidence in your results interpretation. There is another correct answer in this list, have you identified it already?
Remove the cellular material using ammonium hydroxide and then image just the signal emanating from extracellular matrix.
Well, I didn’t really expect this one to get picked! If the cells are removed, the signal that is left will be static and just fade over time. It won’t help us here. Try again.
Your PI doesn’t like your control images in a figure comparing treatment to controls, what changes are you allowed to make?
Use a control image generated as part of a previous study from the same lab
This isn’t fair. What is the reason for the difference between the old data and your current data; likely that reason can account for the difference in your treatment images. You are misrepresenting your data. Don’t do this!
Crop out the parts of the control image that your supervisor doesn’t like
This isn’t fair ; your images should tell the story of the population, if there is variability, then that should be part of the story. Your quantification of your images will tell you what is truly representative.
You can make adjustments to brightness, contrast or colour balance
As long as they don’t obscure or eliminate information then simple manipulation is OK
Repeat the control part of the experiment again to gain better quality images
What is the point of the controls? If you mix and match experiments in your figure you lose the point of including them. Differences will exist between experimental runs that could account for why your data is what it is.
Quiz 4 : Flow Cytometry / FACS
Quiz 6 : Cell / Tissue Culture
You might also like our science phrases grammar quiz – here
