This lab skills quiz is slightly different from the other MCQs. The questions here are more interpretative. They all refer to a single figure taken from a published paper. They use this real information to highlight concepts relating to data interpretation, experimental design, data processing and presentation. In other words, this one is all about putting together the knowledge from core lab skills learning into a real-world context. This is quiz #2 of this type. My plan is to add some more quizzes like this one in the future. bookmark this page or follow the blog to stay updated.
Panel A: serial sections from the front of human eyes have been processed with mouse anti-human LaNt a31 monoclonal antibodies OR with rabbit polyclonal anti-LaNt a31 antibodies (as indicated). Horseradish peroxidase (HRP) conjugated secondary antibodies were then used to detect the primary antibodies (the brown stain comes from where the HRP enzymatic activity has reduced its substrate). Blue =nuclear stain.
In panel B and C: human eye sections have been processed with mouse monoclonal antibodies against LaNt a31 AND with antibodies against laminin a3b3g2, then the antibodies have been detected with fluorescent secondary antibodies. The image at the bottom of C shows the two individual images overlaid with pseudocolours applied as indicated. The two boxed regions are shown at higher magnification in the columns to the right.
The top images in C (the gray background) are images taken with white light. What type of imaging modality is this?
Phase contrast
Yes, we’re imaging through the tissue and using the differences in phases to generate extra contrast. E.g. the borders of cells distort the amplitude of the light waves passing through the tissue. The dark blobs are melanocytes (pointed to with yellow arrows).
Differential Interference Contrast (DIC)
close, DIC is a t is a white light modality but is a way of looking across surfaces rather than through them. Try again.
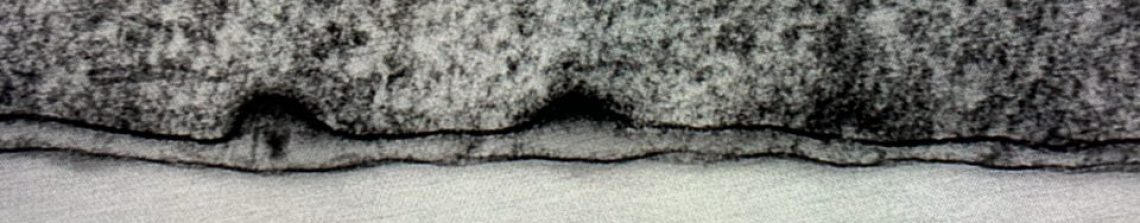
Transmission Electron microscopy
Nope, the images might look vaguely similar to TEM but the scale would be massively different. TEM images are generated by firing electrons at the specimen and collecting the transmitted electrons. Great for zoomed in, high res images but you can’t look at whole tissues and you can’t co-stain the sample with fluorescently conjugated antibodies.
Haemotoxylin and Eosin histological processing
Nope, H&E are stains that label different aspects of the tissue. This is an unstained image, we are using aspects of the native tissue to generate the image.
Scanning Electron Microscopy
SEM scans across a tissue with electrons and generates a really high resolution image of the surface of the tissue. Try again.
The mouse anti-LaNt antibodies are new. This is the first time they have been described. The authors included a number of additional images in the supplemental figures of this paper as controls. Which of the following controls would help demonstrate that the mouse anti-human LaNt a31 monoclonal antibodies are binding LaNt a31 rather than a different protein? There are THREE correct answers here
Images from corneal sections from a pig processed with the anti-human LaNt a31 monoclonal antibodies.
Pigs and humans are quite similar in lots of ways but, in this case, the antigen used to raise the antibodies was not conserved between the two species. The assumption is that although the LaNt a31 sequence is not conserved most of the other proteins would be. Therefore any non-specific cross-reactivity of the anti-LaNt antibodies would be conserved. It’s not a perfect control, but it would increase the likelihood that the protein being detected is LaNt a31 as opposed to something else.
Images from human eyes processed with mouse IgGs and the same secondary antibodies as above.
This control tells you the difference between generic background binding of mouse antibodies versus the binding of the anti-LaNt antibodies. This is useful and it was included in the paper. However, what this control doesn’t tell you whether the anti-LaNt antibodies are recognising LaNt a31 or if they are recognising a different protein. Remember that all antibodies have cross-reactivity to targets in addition to the one they were raised against. Try something else.
Images from human eye tissue probed with the anti-LaNt antibodies but without the secondary-HRP antibodies.
This control would tell you if there was any endogenous horse radish peroxidase activity in the tissue which could be providing the brown stain. It would be useful to know this, but it wouldn’t help you identify if the anti-LaNt staining was really LaNt or some other protein. Try again.
Images from human skin tissue processed in the same way as the eye tissues in A (i.e. with primary anti-LaNt a31 antibodies and with secondary anti-mouse HRP antibodies. Note: previous studies have described LaNt a31 distribution in skin sections.
This is a useful control. It shows you that the signal from the previous antibodies and the new antibodies are similar BUT just because the distribution looks similar it doesn’t necessarily mean that the new antibodies are recognising the same thing. This control is helpful but there are additional controls that can make you even more sure.
Images of eye sections from a person with an inherited disease where LaNt a31 is not expressed, processed with the anti-Lant antibodies and HRP secondaries.
This would be the best control IF it was available. However, this tissue might be really rare and hard to source, if it exists at all. It wasn’t available here, sadly, but if it was it would be the best control for specificity. When you can’t do the best, you need to compromise, can you identify the next best options?
Images from human sections processed with the anti-LaNt primary antibodies but with alkaline phosphatase conjugated secondary antibodies in place of the HRP ones.
You could do this control, but it would only really tell you whether the signal obtained was specific to the method of detection. It wouldn’t tell you whether the signal obtained was LaNt a31 or something else.
In B, the anti-LaNt antibodies were labelled with secondary antibodies conjugated with 488 nm (green) fluorophores, whereas the laminin a3b3g2 was labelled with 654 nm (far red) fluorophores. Assuming the microscope was set up correctly, which of the following options would allow you to resolve the finest detail?
60x 1.4 NA objective with oil immersion imaging the anti LaNt staining
Resolution = 1.22 x wavelength / (NA of the condenser lens + NA of the objective). Using oil increases the effective NA of a lens (x1.52 for most oils). Therefore HIGH NA, LOW wavelength + oil = the best resolution option.
60x 1.4 NA objective with oil immersion imaging the anti laminin a3b3g2 staining
try again.
100x 0.6 NA objective with oil immersion imaging the anti LaNt staining
try again
100x 0.6 NA objective with oil immersion imaging the anti laminin a3b3g2 staining
try again
Laminin a3b3g2 is actually three separate polypeptides, laminin a3, laminin b3 and laminin g2, that fold up together to form a heterotrimeric protein. The antibodies used in this experiment recognise all three polypeptides not only by immunofluorescence microscopy but also by western blotting. Based on that information, what type of antibodies are they?
Rabbit polyclonal antibodies
Yes, the antibodies solution must contain antibodies that recognise epitopes on all three proteins therefore there will be at least three “clones” in the preparation. Realistically, it will actually contain more than three. There will be lots of abs against different parts of the protein. Note it is possible to generate a “conformational” epitope that is present only in the fully assembled trimeric protein but as this antibodies preparation works by western blotting as well as IHC that is unlikely to be the case here (can you think why?)
Rabbit monoclonal antibodies
Have a think about what it means to have a single clone of antibodies in a preparation – what would it recognise?
Mouse monoclonal antibodies
Two issues here – 1) using in a co-stain with the mouse anti-LaNt antibodies would be tricky; how could you tell the difference between mouse ab1 and mouse ab2 (tricky, not impossible) and 2) the single clone of antibodies wouldn’t recognise all three chains of laminin a3, b3 and g2.
Serum from a non-immunised rabbit
How could that work? Have a think and try again!
The purpose of these experiments were to determine where LaNt a31 is distributed in human ocular surface epithelium. These data suggest that the protein is close to laminin a3b3g2 at the dermal/epidermal junction. Which of the following experimental approaches would allow you to determine if the two proteins form a complex with one another?
Immunoprecipitation (IP)
Yes. This technique involves making a protein extract, then using antibodies to “pull down” (i.e. precipitate) a target protein as well as anything else that is bound to it. After a whole bunch of washing to remove weak binding you then do SDS-PAGE followed by western blotting for a candidate binding protein. In this case you could pull down LaNt a31 and blot for laminin a3b3g2 or vice versa.
Mass spectrometry (MS)
MS will tell you which proteins are in a solution but you will need to do some more things first before you can tell if there are interactions
Fluorescence Recovery After Photobleaching (FRAP)
This is an approach to study protein dynamics. You could use it to compare the dynamics of a tagged laminin versus a tagged LaNt, but that wouldn’t necessarily tell you whether they interact or not.
Scanning electron microscopy (SEM)
this is an imaging approach used to see high resolution images of a surface.
Mason’s trichrome staining
This will stain tissue sections giving different coloured stains of cytoplasm, nucleus and stromal tissue
Flow cytometry
This is a way of labelling/identifying sub populations of cells or to measure the cell surface expression levels of specific proteins
Reverse Transcription followed by quantitative Polymerase Chain Reaction (RT-qPCR)
this is a way to measure the abundance (usually relative) of a specific mRNA in a sample
You might recognise this figure, it includes images of LaNt a31 and laminin. These are two of the most interesting proteins in the world. Want to know more? This post describes the rest of this paper in short form. Or read the real thing here.