The ratio of absorption at 260nm to absorption at 280nm is commonly used to assess….
The purity of DNA and RNA with respect to protein. 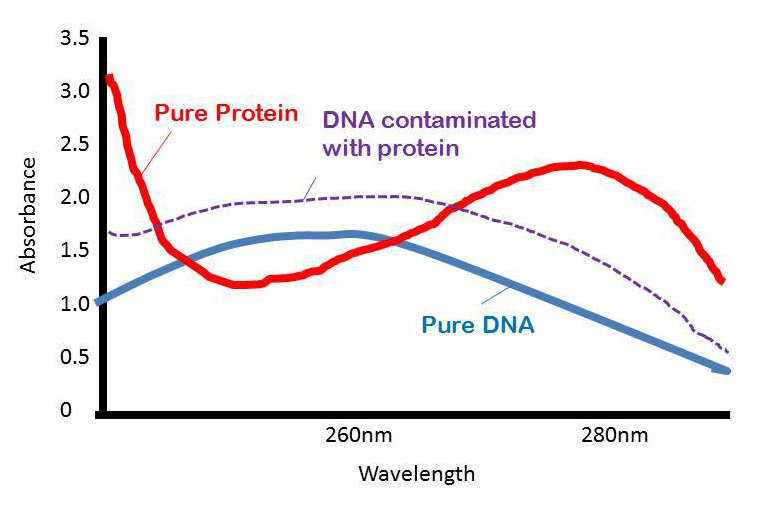 As the amount of protein in a sample increases, the absorption at 280nm increases therefore A260/A280 decreases. The more protein, the lower the ratio will be
As the amount of protein in a sample increases, the absorption at 280nm increases therefore A260/A280 decreases. The more protein, the lower the ratio will be Whether your DNA or RNA is contaminated with organic substances.
Organic substances absorb best at 230nm therefore you would use an A260:230 to assess this.
The concentration of DNA and RNA.
To be fair, you would learn this while taking A260/280 measurements; the absorbance at 260nm on its own tells you about quantity of substance presence. However, the A260/280 ratio provides you additional information that you also should be recording whenever you measure your nucleic acids.
The concentration of protein in your sample.
A280 can be used to measure protein concs… this is a clue for what the correct answer is!
Which of the following A260/280 ratios would be a reasonable cut off for RNA that you intend to use for quantitative RT-PCR?
>1
This is quite low, it suggests your sample is contaminated with protein. Those proteins will inhibit your PCR reaction and give you false readings.
>3
0.5
>1.8
Pure RNA is generally accepted as having an A260/280 ratio of 2.0. You have to decide how pure is good enough for your experiments. 1.8 is quite commonly used but you might need higher or you might need to justify lower (e.g. very rare samples). Whatever you decide as your cut off needs to be made clear in your methods section as it is relevant to the interpretation of your results.
You measure the absorbance at 260nm of your double stranded DNA sample in a 1 cm cuvette and get a reading of 0.15. What is the concentration of your sample? 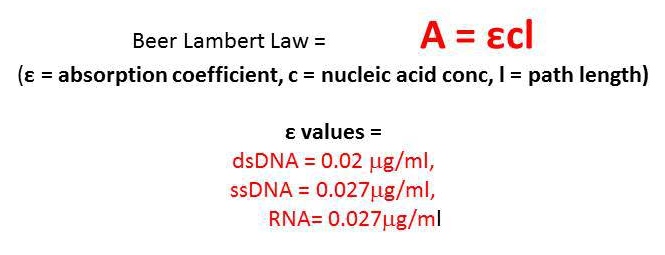
7.5 μg/ml 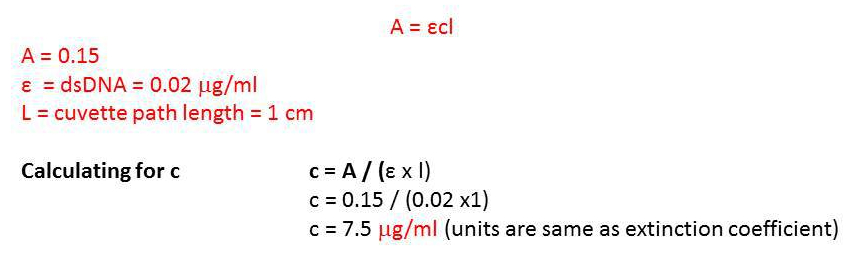
0.003 μg/ml
0.13 μg/ml
13.3 μg/ml
15.0 μg/μl
You have a 1500 ng/μl RNA solution, your protocol says to use 1 ug per RT-PCR reaction what volume of your RNA solution do you need to use?
0.67 μl
1 μg = 1000 ng, if you 1000/1500 = 2/3 = 0.67
1.5 μl
0.33 μl
1 μl
3 μl
You are preparing an agarose gel to run your PCR products on. Your products are 800bp and 1.2kb. From the list below, what mass of agarose would be appropriate if you plan to make up 50ml of gel?
0.5 g
This would give a 1% gel which is about right for this size of product. Realistically 0.75% to 2% would all be OK. You should choose your gel percentages so that they allow good separation around the point where you are interested
0.1 g
A 0.2% gel would be very weak and likely rip apart in your hands
5 g
dissolve 1 g in 10 ml and then add 0.5 ml of this solution to the 50 ml
1g in 10ml = 10 %, 0.5 ml in 50 ml = 1/100 so 0.1% final concentration. It won’t form a gel at all!
After TRIZOL extraction and centrifugation, your tube looks like this. Which fraction should you collect if you want the RNA 
The clear upper phase (aqueous phase)
Got it. TRIZOL can be used to collect RNA, DNA and protein. If you guessed this, click on the other two to see what’s where!
The “fluffy”-looking interphase
The fluffiness you see here is the DNA
Everything except the pink layer
If you do this you will get bother the DNA and the RNA
The pink lower phase (organic phase)
This contains the proteins and other stuff like sugars.
Which of these dyes could you use to visualise DNA run on an agarose gel?
Ethidium Bromide
Ethidium Bromide; binds to DNA and gives a fluorescence signal when exposed to UV light. There are a number of dyes that work in similar ways that are supposed to be a bit safer, things like Midori green, Sybr safe etc. Whether they actually are safer is up for debate so take care!
Coomassie blue
this is a protein binding dye, you would use for total protein stains on a SDS-PAGE gel.
Crystal violet
this quite a generic blue dye, often it used as a cell stain in things like adhesion assays.
Ponceau S
this is a protein dye. Usually it is used to stain proteins on a membrane in western blotting type applications, for example to demonstrate equal loading.
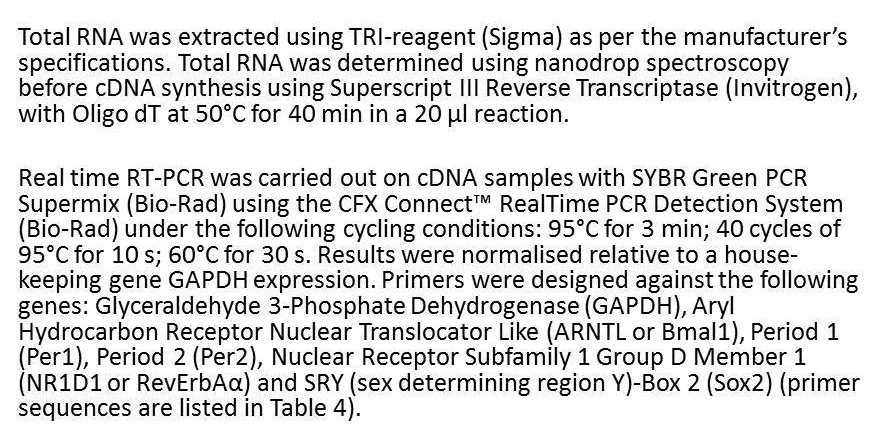
What information is missing from this RT-PCR methods section?
select all that apply
select all that apply
RNA amount used in RT-PCR reactions
Quality thresholds for RNA
Source material e.g. cell numbers and storage
may be elsewhere in methods which would be ok, but needs to be clear somewhere
Primer verification details
Target transcript accession number(s)
maybe in the table but information about what you are/aren’t amplifying is important so should be somewhere!
cDNA used in PCR
analysis methods
calibration and melt curves
nothing, this is sufficient for me to do the experiment, and interpret the data
You treat cells with a new drug that you hypothesise will increase the expression of a laminin gene. You isolate RNA from drug or control compound treated cells and get the following Ct values in your qRT-PCR.

Assuming that your reactions are well optimised, what effect does the drug treatment have?
Assuming that your reactions are well optimised, what effect does the drug treatment have?
laminin mRNA abundance has increased to 4x control levels
laminin mRNA abundance has stayed the same
laminin expression has increased to 2x control levels
laminin expression has decreased to half of control levels
laminin expression has decreased to one-quarter of control levels 
What additional information could you get from a Northern blot that you can not get using RT-PCR or quantitative RT-PCR?

You can identify full length of a specific RNA
RT-PCR allow you to amplify specific regions of DNA. You use primers and amplify the region in between, you don’t necessarily amplify the whole transcript. In a Northern blot, your probe binds to the RNA species at the size where it has run on a gel.
If you want to know where a transcript starts or finishes you could consider a technique called RACE – rapid amplification of cDNA ends – this is a PCR-like technique but, again, will only let you know the length of transcript downstream/upstream of the priming point (and assumes that you have amplified through secondary structure). Select all that apply
Using a Northern blot you can determine the relative abundance of two mRNAs
A Northern blot can do this, but quantitative PCR will do this too (likely with less variation between repeats). Northern blots were what was used before qRT-PCR so you will see northern data in the scientific literature.
Using Northern blot you can determine the relative abundance of splice isoforms with multiple large alternative exons
You can design primers that are specific to different isoforms and use them for qRT-PCR to generate relative abundance; however, most conventional qRT-PCR applications are limited to amplicons of about 200bp so you might struggle to generate efficient primers for longer transcripts. A Norther could help you here. There are also alternate techniques that involve probe binding in similar ways; you may be able to design probes that bind across specific exon junctions, however some highly alternatively spliced genes may have the same exon-exon junction in multiple transcripts, a Northern might allow you to look at all the options in one go.
A Northern blot allows you to study ribosomal RNA and messenger RNA in the same experiment.
You can do this by Northern blotting, but using a mix of different reverse transcription primers could also allow you to do this by RT-PCR.
A Northern blot could allow you duplicate a specific stretch of RNA for cloning purposes.
Northern blots are a way of detecting transcripts, try again
You are investigating a newly developed drug. You design an experiment where you set up the following conditions:
1) untreated cells.
2) Cells treated with new drug diluted in DMSO
3) cells treated with DMSO only You will measure the expression level of five target transcripts against the geometric mean of three reference transcripts for all three conditions. What statistical test would you use for your sample size determination?
2) Cells treated with new drug diluted in DMSO
3) cells treated with DMSO only You will measure the expression level of five target transcripts against the geometric mean of three reference transcripts for all three conditions. What statistical test would you use for your sample size determination?
Chi squared tests
Chi squared tests are for comparing categorical variables.
t test
t tests are designed for comparing two categories only, here you have three treatment groups
1 way ANOVA
This looks like the correct answer as you have 3 treatment groups and continuous outcome variables BUT this approach doesn’t account for the plan to have 5 different outcome variables; the 5 transcripts. If you don’t plan for the multiple comparisons then your study runs the risk of being underpowered.
MANOVA
You are planning multiple comparisons across four groups therefore your sample size calculation should plan for multiple comparisons. a Multivariate ANOVA(MANOVA) might be your best bet. Read about MANOVA here.
You are conducting an experiment from tissue from patients obtained after surgery. Which steps are likely to give the biggest variability in a qRT-PCR assay? Pick the top 3
Patient-to-patient variability
assuming your experimental techniques are well optimised this variability will always be the biggest variability in human studies. Experimental “n” will be decided here.
Sample storage prior to RNA isolation
Ideally the sample will be immediately immersed in liq nitrogen upon removal and storage times will be short. However, even with very careful treatment, there is quite a large scope for differences here; RNA is very sensitive and will degrade easily, small differences here will carry right through your set up
RNA isolation from samples
there are commercial kits available that make this step more consistent but when you are working with chunks of tissue there will have to be some homogenisation steps which gives you a large source of variability… RNA is sensitive to lots of things, shorter/longer or incomplete digestion would be a problem. Any difference in RNA isolation will carry all the way through the rest of your experiments, e.g. inhibitors of PCR will be differentially present.
Reverse transcription of RNA to cDNA
This step is usually quite consistent compared to the others, there will be variability introduced here but it likely won’t be as big as some of the others. You can determine how much by doing two separate RT reactions with the same source RNA and comparing the results thereafter
qPCR set up for target genes on each cDNA
There will be variability here but it will arise from in-precise pipetting rather than biological variability. The same cDNA should give you very similar results
Differences from run to run in PCR machine heat/cooling cycles and fluorescence detection
Although there will be differences here but they should be small. You can design in controls into each run to confirm that there has not been a problem
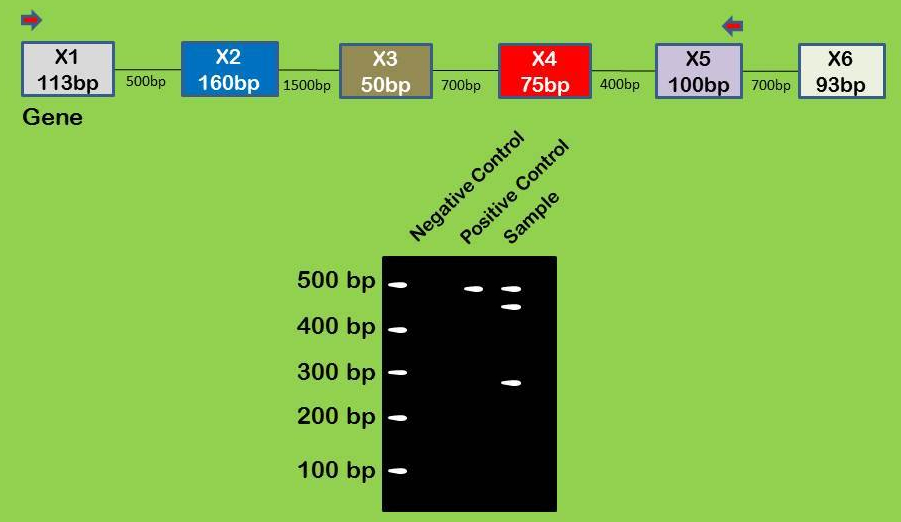
You have set up a PCR testing for presence of a transgene in your new mice line. You are using primers you have used successfully used previously. You have the following samples: A plasmid DNA that you prepared previously and used to test the plasmids (lane 1), a reaction with no DNA (lane 2), and four mice DNA samples that you are investigating (lanes 3-6). You run the samples on a gel and observe a band in lane 1, no band in lane 2 and no bands in lanes 3, 4, 5 and 6. What are the potential explanations of these data? select all that apply
The four new samples don’t contain the transgene
Yup, the simple answer is definitely possible! Unfortunately, it’s not the only explanation.
The mice DNA you have isolated is poor quality
Yes, you don’t know yet if your samples are any good. A simple explanation is that they aren’t! Run another PCR with for a gene you know will be present to check DNA quality.
Your primers have degraded
The PCR worked for the positive control, therefore you don’t have reason to believer the primers are “off”
Your PCR machine is broken
There was a problem in loading or running the gel
 In the figure above, large boxes indicate exons with the size indicated within the box. Introns are shown as lines with their size indicated beneath the line. Red arrows indicate where your PCR primers bind. Your positive control is a plasmid that has X1, 2, 3, 4, and 5 without any intronic sequence within it. Your sample is cDNA generated from a cell line. How can you explain the extra 2 bands in your sample compared to the control?
 They are alternative splice isoforms; (X1, 2, 4, 5 = upper band) (X1, 4, 5 = lower band)
Linear DNAs (such as PCR products) run at their size, so if you have a well resolved gel you can look to the size for interpretation purposes. Most genes are alternatively spliced in some way, here the exons could be organised in a variety of ways with different sized products (see below). Although this interpretation makes sense I would still check e.g. by sequencing the extra bands.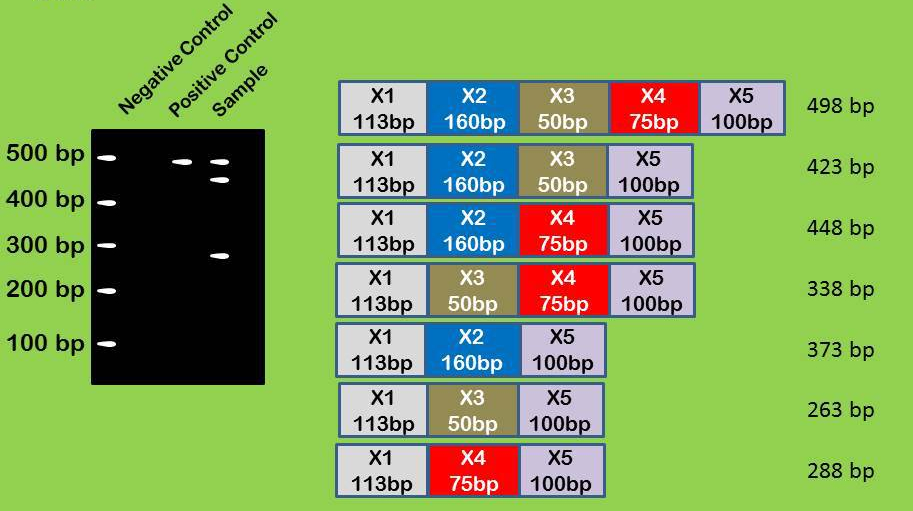
You are seeing the 16S and 28S bands from the sample’s RNA in addition to the PCR product
While making the cDNA you use very little RNA and also include an RNAse step to digest it, it’s very unlikely that these RNA species would be in your final reaction and, even if they were, they wouldn’t be very abundant and wouldn’t run at these sizes.
You contaminated your sample cDNA with genomic DNA from a rabbit
For this to work as an explanation, your PCR primers would have to recognise a coupe of places in the rabbit sequence. Technically possible but not the most likely explanation of these data
Your sample is contaminated with genomic DNA
Although you could have genomic DNA contamination, a PCR using these primers would give a very long product rather than the shorter products observed here
Your RNA degraded before you reverse transcribed it to cDNA
The two primer sequences are still present in the cDNA within your sample (otherwise you would get nothing). If all your RNA had degraded you would lose all the bands in this experiment. Partial degradation would unlikely to have cut out the parts between the two primers. Good guess though! Smaller molecular weight bands in western blots can sometimes be explanation by partial digestion.
You are reviewing a paper and the graph below is Figure 1A.
 Q1: Which of the following experiments could this graph refer to? (select all that apply)
Q1: Which of the following experiments could this graph refer to? (select all that apply) PCR from genomic DNA of four different cell types
Endpoint RT-PCR from treatments A, B, C and D compared with untreated
Endpoint RT-PCR won’t give you this sort of quantitative data
qPCR comparison of a transcript of interest from cDNAs generated from untreated cells and cells after treatments A, B, C and D.
Yes, this is a plausible answer, the labelling isn’t brilliant (see Q2) but this is the sort of graph that could be generated from those type of data
Identification of mutations by analysing sequencing data between samples A, B, C and D.
The “fold change” part means that there is some quantitative measurements being compared. Plausibly it could be a measurement of mutational frequency i.e. #mutations/kbp and plotted as fold change in mutational rate.
Relative abundance of mRNAs A, B, C and D in treated cells compared with untreated cells
Yes, this graph could represent those data. Better labelling could have removed ambiguity, see Q2.
Q2. Turns out, the authors wanted to compare four different drug treatments against an untreated sample. What labelling changes would you request to improve the clarity of the figure? (ignore that this is a bar chart, let’s assume for now that this is OK for these data…)
Y axis – indicate what reference transcripts were used for normalisation
This helps the reader interpret the data, it’s part of the results. The details could be in the figure legend but adding a few words to the y axis would make the information clearer.
Indicate transcript/gene name being compared somewhere on the figure
Not a big ask! I don’t want to have to hunt for this information, make it clear and easy to see
Provide more descriptive labelling of samples; e.g. the drug names rather than arbitrary lettering.
Hunting for details in the figure legend or, worse, elsewhere is annoying! Labelling the treatments makes the data easier to understand
Change the Y axis to absolute abundance
You could ask for this information to be included in addition to the fold change if you felt it was relevant to the story. However, if the question this experiment was designed to address related to change in expression relative to untreated then an absolute abundance graph could be harder to interpret, especially with the relatively small changes.
Change the Y axis to say “mRNA expression”
May not necessarily be required, but if, for example, Figure 1B referred to the same data but at the protein level then this addition could help remove ambiguity.
Change the colour scheme to shades of gray
I agree, there probably is no advantage of colour here. However, it’s probably OK. If the colour has potential to influence the data interpretation is should be changed. Similarly, if the colour choice wasn’t great for colour blind people then it should be changed. Here the colour doesn’t add anything or influence the interpretation. (In case you are wondering I can’t work out how to change the colours from green and red to signify right and wrong in this quiz!)
Change from a logarithmic scale to a linear scale
You could request this change if you want, but a log scale is appropriate for these data so I am not sure what the justification would be. In the graphs below I have made the blue treatment double the expression level, and the red treatment halve the expression level. The scale of the change is the same but in different directions. You can see how the same data would look on different types of graph. When making your figure, you have to decide what tells the story of your data in the most accessible and easiest to see way.

Q3. The gene they are studying is called PTO4. The four treatments are; a new drug Zoombastin dissolved in DMSO, a drug, Fluastin that has been shown to increase PTO4 expression in zebrafish, a drug called Notibimin that blocks a transcription factor that drives PTO4 expression, and cells treated with DMSO only. Assuming that the known drugs work as predicted in this model system, what do you think the sample order is?
A: DMSO B: Fluastin C: Notibimin D: Zoombastin
DMSO should have very little effect, fluastin should increase expression dramatically, C notibimin should decrease expression and zoombastin could have any effect at all. B and D could go the other way round
A: Zoombastin B: Fluastin C: DMSO D: Notibimin
A: Notibimin B: Zoombastin C: DMSO D: Fluastin
A: DMSO B: Zoombastin C: Fluastin D: Notibimin
You are designing an experiment to test a hypothesis that miRNA 194 targets PAX2 mRNA for degradation. Your boss suggests treating cells with a miRNA mimic or inhibitor, extracting mRNA and using quantitative RT-PCR to compare the PAX2 mRNA levels in the treated cells to the levels in untreated cells. Q1: Is this measurement direct or indirect?
Indirect
Yes, you aren’t measuring mRNA degradation but rather relative mRNA abundance. Doing the experiment in this way, you would infer from a change in level that the difference was due to differential degradation but it could instead be that the treatments have affected the expression of other things, the mRNA changes could be due to changes in transcriptional rates.
direct
Nope, This experiment would examine PAX2 mRNA abundance not degradation
Why might your boss suggested doing the experiment as outlined in the previous question?
For the hypothesis above can you think of another experimental set-up that would help your interpretation?
Once you have thought of your answers click on the link and see if they match mine.
Why you might use the qRT-PCR approach?
Quick, cheap and easy! All you really need is a few sets of primers and some miRNA mimics. You can buy these, test the primers and then do the experiment. So although this experiment isn’t perfect it might be the best place to start. Note: I would adjust my hypothesis here to more accurately reflect what my experiment was testing.
Alternative experiment
A few options here. You could inhibit transcription (using actinomyosin D) and do a time course experiment isolating RNAs at different points after both treatments. Then you would compare the rate at which PAX2 levels dropped. Again this is still indirect, other factors could be at play, but it would be a bit better as it would remove one alternative interpretation.
Another option would be to generate a reporter construct for example using a coloured protein or luciferase gene followed by the 3′ UTR of PAX2. This would take some time and effort. Ideally you would then mutate the putative miRNA binding sites (seed regions) and then compare the effects of the mimic treatments on the decay rates. This experiment would tell you if your miRNA was capable of degrading the mRNA but it doesn’t mean that it does so in normal conditions. There are some other options but these three approaches are quite commonly used in the literature. Likely the answer is to use a combination of approaches and get the best answer you can. It’s rare that you will find the perfect way to do any experiment so this sort of triangulation is usually what you need to do.
Quiz 4 : Flow Cytometry / FACS
Quiz 6 : Cell / Tissue Culture
You might also like our science phrases grammar quiz – here
