
What might happen if you forgot to add glycerol to your cell lysis buffer and then used it for SDS-PAGE?
If would be difficult to load your proteins.
Yes, the glycerol makes the protein solution heavier than the running buffer, therefore the glycerol helps your protein solution sink into the well
Your proteins wouldn’t be negatively charged
It is the SDS in your sample buffer that does this for you, glycerol does something different, try again.
Your proteins would aggregate into dimers/trimers
Your reducing agent (BME/DTT) and a denaturation step (e.g. heating) are what prevent this from happening.
You wouldn’t be able to see your proteins
most SDS PAGE buffers include a dye such as bromophenol blue to help visualise the proteins as you load them.
Your western blot gave two bands in each lane, which of the following is/are potential explanation(s)? – select ALL that apply.
One of the bands is due to non-specific binding of the primary antibody
Yes, non-specific binding is always a possibility… can you think of how you could determine if the “extra” band is non-specific or not?
There are two isoforms of your target protein
Yes, this is an option, the two isoforms would both have to have the same epitope available for the antibody to be able to bind.
Your protein has been post-translationally modified
things like proteolytic processing events could remove part of the protein, or glycosylation events could increase the mass which could explain the different sizes
You have used the wrong secondary antibody
Unlikely, if you did that you would just have background staining + markers visible. Try again.
You forgot to add bromophenol blue to your lysis buffer
this is just a dye so you can see your sample, shouldn’t affect how the proteins run/appear on the blot
Your antibody concentration is too low
Too low usually would mean weaker signal/less bands rather than more bands, try again.
What happens if you use your primary antibodies at too high a concentration?
You will overexpose the areas where your protein of interest is.
too much ab won’t increase the binding to your target protein, that should already be saturated. Think again.
You will get increased non-specific binding.
No antibody is perfect, they should have high affinity for their target but they will also recognise other proteins with lower affinity. The concentration you use should be optimised to maximise binding to the target while minimizing off-target binding.
All the excess antibodies will soak into the blotting chamber and ruin your next blot
Your antibodies will bind to themselves instead of to the target antigen
You have just bought a new antibody, which of the following options for samples/conditions would help you to determine which band on your western blot is the real protein compared to non-specific bands?
Probing with secondary antibody only.
This will tell you where the secondary antibody binds, it won’t help you identify which band is real and which bands are non-specific.
Loading a dilution series of your protein sample
This could help, your ab should have highest reactivity to the band of interest but if the non-specific protein is highly expressed and your target has much lower expression, then your non-specific bands will still be recognised at lower concentrations. You should still do this dilution series as part of your pilot experiments… do you know why?
A sample where you have added a drug that you know will have no effect on your protein expression.
This sort of control is an experimental control to show whatever you are studying is real, it won’t help you identify your target protein
A sample where the expression your protein of interest has been knocked down.
Yes, this could work. A question you might have asked yourself here is “how will I know knockdown is successful before I blot” and that is a good question! However, if you don’t have anything else, you could rely on qRT-PCR data to show reduction at the mRNA level. A better option could be to use a genetically depleted cell line or animal tissue (e.g. from a knockout mouse, patient cells or CRISPR’s line), or a sample from a tissue that doesn’t express your protein, or a sample from a species that you can predict your ab won’t cross-react with.
What are ELISA plates with antigen-coated wells used to measure?
The levels of antibodies to the antigen that are present in a solution
Yes, this sort of ELISA could be used to determine if a patient or animal sample contains specific abs to the antigen for example in diagnosis of autoimmune disorder or to test resistance to a pathogen.
How the secondary structure of the antigen changes in response to increasing pH
Antigen to antigen interactions
Sugar content of the antigen
Whether the antigen has been phosphorylated
Which of these is not the name of an assay to determine protein content?
Bradford
Lowry
Bicinchoninic acid assay (BCA)
Laemmli
Yes! This is the name of a widely used lysis buffer (final concentration; 2% SDS, 10% glycerol, 5% 2-mercaptoethanol, 0.002% bromphenol blue and 63 mM Tris HCl, pH approx. 6.8.)
You want to run a 7.5% acrylamide gel to run protein samples on. You need to make up 10 ml of gel solution from the 30% stock bottle, what volume do you need?
2.5 ml
(M1 x V1) = (M2 x V2). M1 = 30%, M2 = 7.5%, V2 = 10 ml. (7.5% x 10ml) / 30 % = Volume required in ml = 4 ml.
750 μl
1 ml
250 μl
You need to make up a 10% ammonium persulfate solution. What mass of powder will you need to make up 5 ml of solution.
0.5 g
a 1% weight/volume solution requires 1 g in 100 ml. Therefore a 10% solution is 10 g in 100 ml. To make 5 ml would require 5/100 x 10 = 0.5 g
5 g
10 g
0.1 g
Which of the following statements about SDS polyacrylamide gel electrophoresis is correct?
Enzymes retain their biological activity after separation by SDS polyacrylamide gel electrophoresis.
To be able to run the proteins on the gel you first denature them, enzyme activity is dependent upon the folding of the protein. A denatured enzyme won’t work.
Proteins are solubilized but not denatured when separated by SDS polyacrylamide gel electrophoresis.
SDS polyacrylamide gel electrophoresis separates proteins on the basis of charge.
SDS polyacrylamide gel electrophoresis separates proteins on the basis of size.
Your antibody data sheet says that the antibody works for immunoprecipitation but not for western immunoblotting. Can you predict which type of antibodies these are, and what they were raised against?
A mouse monoclonal antibody raised against purified protein extracted from human tissue
In a western blot, you denature the proteins so that they run as a (almost) linear protein. For an antibody to work by western blotting they need to be able to recognise the specific stretch of sequence. In monoclonal antibodies you only have antibodies that recognise a single epitope. In this case, the epitope that was selected for may only be present in protein that is in its native conformation. With rabbit polyclonal abs, there is more chance that at least one of the abs in the mixture will recognise a linear stretch of sequence and therefore the ab will work for westerns as well as IP. Note that some mAbs will work for IP and western, and some rabbit pAbs will work for one technique but not the other; this question was designed to make you think about how abs are raised and why knowing what they were designed against can help you.
A mouse monoclonal raised against a 20 amino acid peptide sequence
Try again, explanation in the correct answer
A rabbit polyclonal raised against the native protein
Try again, explanation in the correct answer
A rabbit polyclonal raised against a 20 amino acid peptide sequence
Try again, explanation in the correct answer
For which of the following hypotheses would a sandwich ELISA be a good choice?
Knockdown of protein LT will increase the cell surface expression of protein KH1
flow cytometry would work best here. Try again.
miRNA 10792 binds to the 3′ UTR of ZIP4
this would require a mRNA assay e.g. express, tag and then pull down the 3’UTR via the tag and then probe for the miRNA
To determine the expression of protein SPH14 in culture media
An ELISA could be used for this, but this isn’t a hypothesis! Bit of a trick question, I know, but remember that hypotheses are testable statements. Phrased like this, this statement is an aim.
Protein KRN forms a complex with LDT
This would be tested by immunoprecipitation or maybe a direct binding assay
Expression of protein CnRo increases in epidermal keratinocytes upon treatment with a Fluostine
Yes, sandwich ELISAs allow you to determine the concentration of a specific protein in solution, therefore, assuming CnRo can be efficiently solubilized in an ELISA compatible buffer, you could use this technique to compare expression between treated and untreated conditions.
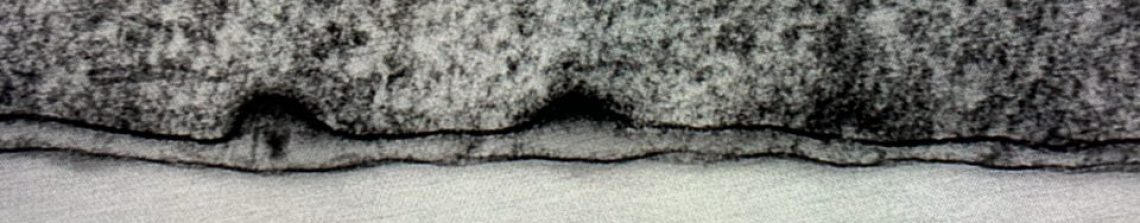
 You prepare protein extracts from four different tissue types, and get the blot above when you probe the samples for your protein of interest, an extracellular protein called IA1n. According to your antibody data sheet you expect a band around 130kDa. How could you explain these data?
 The protein is differentially glycosylated in the different tissues.
The difference in sizes between four different lane are probably ~30kDa. It is hard to say exactly whether this is an increase in size in the left lane or a decrease in size in the right lane but based on the predicted MWt, it’s more likely to be an increase. The change is too big for a phosphorylation event, but glycosylation can account for this shift.
The protein is phosphorylated in different positions in different tissues
Good guess but the size shift is probably too big for phosphorylation events, try again.
A problem occurring during the transfer/
The blot looks fine, it’s unlikely to be a transfer issue. Usually if you have transfer problems you would have gradients of darkness or distinct patches where the bands are missing. Try again.
You used too much acrylamide in your gel solution
This would just lead to less separation between lanes, your samples should still run the same
The proteins have degraded to different extents
This is possible, but there are two reasons why I think it is unlikely here i) It looks like a size increase relative to the predicted MWt and although proteins don’t run exactly where you expect them to, the biggest sample is about 30kDa bigger than predicted. Quite a lot for the data sheet to be off by. ii) Degradation usually happens at the same points within a protein, points that are accessible and sensitive to proteases. It is possible that different degradation is happening but there is a different explanation that could also work too
The pH of your lysis buffer was too high
Match the buffer to the protein: Protein A: epidermal growth factor, Protein B: integrin b4 (a transmembrane protein), Protein C: keratin 14 (an insoluble cytoskeletal protein), Protein D: Sox9 Buffer 1: 6M Urea, 1% SDS, Buffer 2: 50mM Tris HCl pH 8.0, 1% Triton X-100, 0.5% sodium deoxycholate, 150mM NaCl. 0.1% SDS Buffer 3: 50mMTris HCl pH 7.5 (a transcription factor)
A=3, B=2, C=1, D=2
This question is to encourage you to think about the proteins you want to investigate at all stages of the blotting process. Different protein biochemistry will influence their solubility in different conditions. For simple soluble proteins, you can likely use less stringent conditions that other proteins, hence Tris alone would be enough, for the transmembrane protein or the nuclear protein, you may need ionic detergents to solubilize the membranes, hence the using the RIPA buffer with SDS, Triton X and sodium deoxycholate. For large structural proteins, you may need to go even further; urea/SDS buffer could be needed. If you don’t think about this beforehand you may find that the stuff your are interested in is in the pellet and not on your blot!
A=2, B=3, C=2, D=1
A=3, B=3, C=2, D=1
A=1, B=1, C=1, D=3
You are planning an experiment to determine the relative expression between 10 different cell types, of a newly discovered protein that binds to a variety of cytoskeleton proteins (estimated size ~20kDa).
Q1: Which of the following options would you use to set up the experiment? You want to determine which cell type makes the most of this new protein on a per cell basis.
Trypsinise and count, then make total protein extracts from the different cell types, run on a 15% SDS-PAGE gel and transfer for 30 mins to a PVDF membrane. Use ponceau S to confirm equal transfer and use image to quantify total protein present on the membrane. Probe with primary antibodies against new protein and then horseraddish peroxidase conjugated secondary antibodies against primary antibodies. Detect location of secondary antibody binding by providing peroxidase substrate and detecting chemiluminescence. Quantify band intensity by densitometry and use to total protein stain to normalise for differences in protein loaded and plot expression relative to total protein based on these normalised values.
This question is for you to identify the decisions you are making in your experimental set up. Here we are considering two key questions; i) gel percentage, transfer time and membrane type. ii) how to account for equal loading. i) 15% gel, short transfer time and PVDF are best for looking at a smallish protein, higher percentage will give you better resolution in the correct size range. This option is appropriate for this question. ii) This option uses total protein loading as measured on the membrane as it’s method of normalising for total protein. This approach has some advantages over the others in that it is a direct, on blot, measurement. You are being as fair as possible, and you are able to demonstrate that you have been fair in your comparison. However, different cell types will make different amounts of total protein and therefore this experiment won’t tell you which cell makes the most of your protein, it will only tell you which cell type makes the most relative to other proteins in that cell. A slightly different question; useful information but not explicitly what you wanted to know!
Trypsinise and count your different cell types and then make total protein extracts using different volumes of lysis buffer to normalise for number of cells. Run the samples on a 15% SDS-PAGE gel and transfer for 30 mins to a PVDF membrane. Use ponceau S to confirm transfer has worked effectively. Probe with primary antibodies against new protein and then horseraddish peroxidase conjugated secondary antibodies against primary antibodies. Detect location of secondary antibody binding by providing peroxidase substrate and detecting chemiluminescence. Quantify band intensity by densitometry and plot expression based on densitometry determination of band intensities
This question is for you to identify the decisions you are making in your experimental set up. Here we are considering two key questions; i) gel percentage, transfer time and membrane type. ii) how to account for equal loading. i) 15% gel, short transfer time and PVDF are best for looking at a smallish protein, higher percentage will give you better resolution in the correct size range. This option is appropriate for this question. ii) Here you have normalised for cell number and therefore, assuming you have effectively solubilised the different samples, you can interpret the sample with the highest band intensity as the cell type that produces the most amount of this protein per cell.
Trypsinise and count your different cell types and then make total protein extracts. Use a Bradford assay to determine total protein concentration in each sample then load 20μg per lane on your 15% SDS-PAGE gel and transfer for 30 mins to a PVDF membrane. Use ponceau S to confirm transfer has worked effectively. Probe with primary antibodies against new protein and then horseraddish peroxidase conjugated secondary antibodies against primary antibodies. Detect location of secondary antibody binding by providing peroxidase substrate and detecting chemiluminescence. Quantify band intensity by densitometry and plot expression based on densitometry analysis of band intensity.
This question is for you to identify the decisions you are making in your experimental set up. Here we are considering two key questions; i) gel percentage, transfer time and membrane type. ii) how to account for equal loading. i) 15% gel, short transfer time and PVDF are best for looking at a smallish protein, higher percentage will give you better resolution in the correct size range. This option is appropriate for this question. ii) This option uses total protein concentration in each sample to balance loading. This approach is fair but Bradford assays aren’t perfect and you aren’t accounting for any differences in loading and transfer. Moreover, different cell types will make different amounts of total protein and therefore this experiment won’t tell you which cell makes the most of your protein, it will only tell you which cell type makes the most relative to other proteins in that cell. A slightly different question; useful information but not explicitly what you wanted to know!
Trypsinise and count your different cell types and then make total protein extracts. Use a Bradford assay to determine total protein concentration in each sample then load 20μg per lane on your 15% SDS-PAGE gel and transfer for 30 mins to a PVDF membrane. Use ponceau S to confirm transfer has worked effectively. Probe with primary antibodies against new protein and with primary antibodies against the nuclear protein lamin A/C (~70kDa), and then probe the blot horseraddish peroxidase conjugated secondary antibodies against both primary antibodies. Detect location of secondary antibody binding by providing peroxidase substrate and detecting chemiluminescence. Quantify band intensity by densitometry and use to lamin A/C levels to normalise plot expression based on densitometry analysis of band intensities.
This question is for you to identify the decisions you are making in your experimental set up. Here we are considering two key questions; i) gel percentage, transfer time and membrane type. ii) how to account for equal loading. i) 15% gel, short transfer time and PVDF are best for looking at a smallish protein. This option might work but is a little high % and short for lamin A/C. ii) This option uses lamin A/C abundance in each sample to balance loading. This approach is fair but it assumes that lamin A/C abundance is the same across the different cell type. This could be fine, but it also may not be. Realistically, you would have to prove that lamin A/C is consistent first before you moved on to the new protein. Even then, the size difference between your target protein and your reference protein would make me a little uncomfortable in the choice. Differences in transfer efficiency at the different locations within the gel, and potentially differences in solubility of the different target proteins would make me a little concerned about whether I am making a fair comparison.
You are planning an experiment to determine the relative expression between 10 different cell types, of a newly discovered protein that binds to a variety of cytoskeleton proteins (estimated size ~20kDa).
Q2: Which of the following statistical tests would you use to determine sample size required?
1 way ANOVA
1 way ANOVAs are used to test multiple independent variables (cell lines) against a single outcome variable (protein abundance per cell)
2 way ANOVA
2 way ANOVAs are for when you have layers of independent variables, e.g. here if you wanted to first split the cell lines into immortalised vs primary and then compare the abundance within each group. This is a reasonable thing to do, but it’s not implied in the experimental set up so is not an appropriate test here.
MANOVA
MANOVAs (multiple ANOVA) are for when you have multiple independent variables and multiple outcome variables. Here your data will be relative expression of your new protein after it has been normalised in some way (e.g. protein/cell), this is only a single measurement therefore you don’t need to account for multiple comparisons
linear regression.
Linear regressions involve continuous independent and dependent variables. Here your test are discrete units (different types of cells) therefore this isn’t appropriate, try again.
You might also like our science phrases grammar quiz – here
Like these? You’ll love my book. It’s filled with everything you need to be successful in a science career. The ebook is really cheap from via this link.

