

Correct. This is the same situation as the income equality we looked at in Q1. Hopefully you got it really quickly!
By just knowing these three numbers you should be able to picture in your mind the curve – we know we will have a peak in the distribution at the mode (50), but the middle value of the population is to the right of that meaning there is more of the curve to the right of the peak than the left…. the right option in the graphs below.
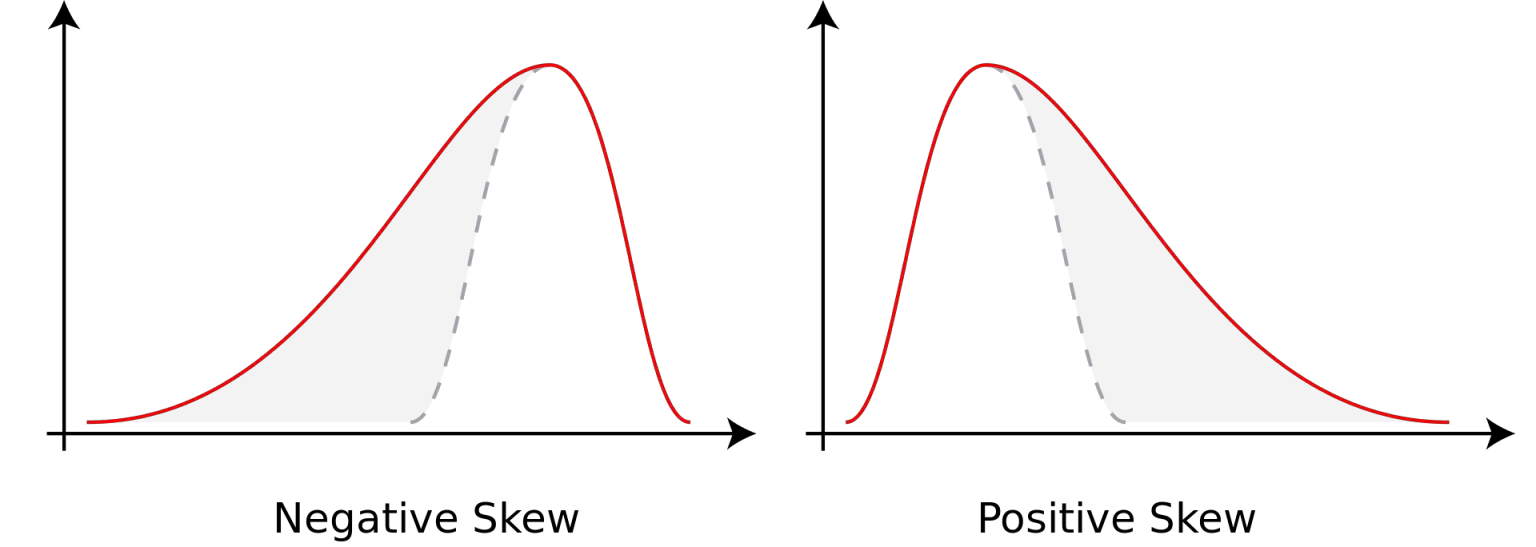
Why all this emphasis on skew? Two reasons, firstly it is important to consider when deciding which of the central tendency (and dispersion) values to report, i.e. which will best describe the population. Secondly, many of the statistical tests are designed for data that are normally distributed (a Gaussian distribution).
Before we move on entirely, let’s look at the other aspect of distribution that can mean even a symmetrical distribution isn’t “normal”… kurtosis. Diagram belwow shows the types of kurtosis you might observe. Note that a perfectly normal distribution has a kurtosis value of three, so less than three is negative, above three is positive.
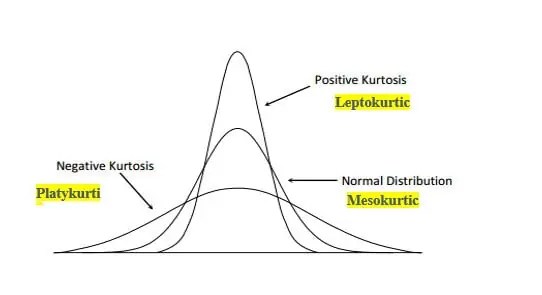
In which of the following problematic situations might the outcome be positive kurtosis?
