

Although your p value may not have reached the statistical significance threshold it doesn’t mean that you shouldn’t share the observations. However, it does mean that you need to be careful in how you write about them. Often I find students struggle in this situation. This post will explains options you could take.
Further down this page I provide example text for talking about differences when p is above or below your significance threshold and for talking about things being the same. But, first, let’s deal with three quick things that are important.
Reporting bias – your observations matter and should be shared.
We have a problem in the scientific literature; there is a bias toward reporting only those results that are “statistically significant”. This is not surprising. When you say something is significant you are really saying that it is unlikely to have arisen by chance and therefore should be taken seriously. However, if 20 people do the same experiment and one person gets a “significant” result and the others don’t then only the “good” result makes it into the literature, then the scientific record will be an inaccurate picture of the real situation.
As a researcher you should report your findings irrespective of what they are. You do the research to find the answer, not to only find the answer if you like that answer! Sharing negative data is essential if the combined weight of the literature is going to be accurate.
In scientific writing, “significant” should be reserved for talking about statistics.
Significant in science writing is a measure of confidence.
“Significant” is used in general speech and writing as an adjective to mean important, meaningful, or large, or all three at once. In this context, it is subjective and often it is favoured by politicians and newsreaders as a emphasis word that they can’t be pressed upon to define.
In science writing unless you put a modifier such as “biologically” in front of significant, then a reader will always assume that “significant” means that the p value is below a certain threshold. It does not and cannot imply magnitude or importance by itself . Indeed you might be accidentally implying small! Therefore, please please please don’t use significant to mean big or important in your writing, it causes unnecessary ambiguity.
As you will see shortly, I advocate for not saying (statistically) significant very often either, usually you shouldn’t need it.
The opposite of significant is “not significant”
Insignificant means not important/small.
Not significant means didn’t reach the confidence threshold.
(your results could be significant but also insignificant (confident but not important) or your observations could be significant but not significant (important but not confident).
The potential outcomes from a (pretty standard) two group comparison
In a standard sort of experiment comparing group A vs group B there are 4 potential results:
- [A is bigger/smaller than B] and [you are confident* about the result].
- [You observed A to be smaller/bigger than B] but [you are not confident about the result].
- [A is the same** as B] and [you are confident that they are not different].
- [You observed A to be the same** as B] but [you are not confident that they are the same].
*confident here refers to the calculated p value being below the critical threshold for statistical significance. Often p<0.05, but not necessarily – the number depends on what type of study you are doing and what confidence you need. As this is a decision, you have to define this significance line before the experiment AND you have to tell the readers of your work where you drew the line.
**same here doesn’t mean identical but rather that the two groups are close enough so that one cannot be considered superior/inferior to the other. How big that difference can be should be defined by the system. For example, a 1% difference in expression of a structural protein might have no biological consequence where as a 1% difference in expression of potent cytokine might by biologically relevant more on how we deal with these below.
1. Talking about differences where you are confident (P<0.05)
The easiest one first. Where your means are different and the p value is below the critical threshold, you can use definitive language to describe the findings:
“A” was (X%) larger/smaller than “B” (A mean±SD Z1±C1, B Z2±C2, p=0.0Y Stats test name)
Note 1: that the word significant is not present in that sentence. There are two reasons for this. Firstly, significance is implied by the phrasing, you haven’t implied doubt. In default science writing, you could not write a sentence with this level of definitiveness unless you inferential statistics meant you could be confident about that result. Secondly, you report the calculated p value in the parenthesis, there is no need to repeat it in the text.
Note 2: the sentences contains direction and magnitude of the effect. There is no point telling a reader that things are difference but not telling them by how much! One sentence is all you need, you do not need a sentence focused on confidence and then another sentence on the effect.
Note 3: the actual p value as calculated by the test is what you write in the brackets as well as the test and any pertinent info like degrees of freedom.
Option 2:
Whereas X was not significantly different from Y, Group A displayed a statistically significant 10% increase compared with B ( X mean±SD Z1±C1, Y Z2±C2, p=0.4, A Z1±C1, B Z2±C2, p=0.01 Stats test name)
Occasionally (rarely) you might feel you need some extra emphasis on the confidence in the observation. In these rare cases it is OK to mention “significant”. However, this is quite rare, usually only in situations where you have some non-significant results surrounding one or two that reach the threshold. In these unusual cases your writing might benefit from some added but selective emphasis. If you write “significant” in every sentence it is not providing emphasis.
2. Observed differences but without confidence (P>0.05)
Here your experimental data showed a difference between the groups but your stats test returns a p value that is “not significant” – i.e. you cannot be confident that the observation isn’t a false positive / type I error.
The questions you should ask yourself are about value and emphasis. What would a difference you have observed mean if it were real? What value might a reader place on the observation? What effect does being not-confident in the result have? The answers can guide you whether you should mention the observation in the text or not (the observation will be in your figures/tables anyway).
There are some generalised field-specific differences on how we deal with non significant data too
In clinical or otherwise applied research, results that fall short of a significance threshold often have implications in terms of choice of onward direction. For example, if you aren’t confident that an effect is real, then you would not prescribe a treatment based on that result. Therefore the failure to reach statistical significance is the most relevant, most valuable information for the reader. The emphasis should be on the significance.
However, in discovery science you are much more likely to make observations that “could be of interest if they turned out to be true. Your readers will likely want to know about all the data and they will be able to cope with relative levels of doubt. Here including both the observation and the statistics in the text of a sentence may be appropriate BUT the phrasing must be extremely careful.
This leads to two options for reporting;
Option 1
“Observed differences between A and B were not statistically significant at an α level of 0.05 (A mean±SD Z1±C1, B Z2±C2, p=0.YY Stats test name)”
Option 1) is direct and short; the results are there (in the brackets) but the emphasis is on the confidence or lack thereof.
Note: Again, the brackets contain the actual p value rather than >0.05 (or whatever).
Option 2
“The observed mean of A was X% higher/lower than B, this difference did not reach statistical significance an α level of 0.05 (A mean±SD Z1±C1, B Z2±C2, p=0.YY Stats test name)”
This is the option you would use if you think the observations are potentially interesting to your readers. Option 2 is complete and unambiguous in the text, but it increases the emphasis upon the observed data.
For this second option, the statement about the level (the α / type I error rate) is important and should be included. You must make it abundantly clear that you aren’t confident about the result but are reporting them out of completeness. [If you keep your significance threshold constant, you may not need to repeat the alpha part it in such length]
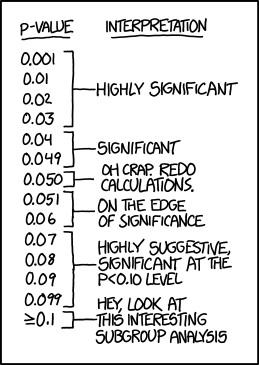
P=0.051

Significant and not significant are binary outcomes. What do you do with the edge cases? Always keep in mind that the α level is an arbitrary cut-point. Scientific or clinical context is critical in differentiating “statistical significance” from biological significance. When designing your experiment and when reporting your data you must consider what a difference between p=0.049 and 0.051 actually means.
I recommend reporting the observations directly and completely and I stand by that.
Don’t use – “trending toward significance”
You might have seen it in papers, but “trending” definitely isn’t recommended. The implication by “trending” is that if more samples were tested then the p value might drop. But you don’t know that. Trend literally means it is changing; that the p value used to be 0.06 now its down to 0.051 and in the future it will become 0.049. Do you have those data to make that statement? (You shouldn’t).
A key point; your decision about sample sizes happens before you do the experiment. Implying after the fact that you should have done more is ….telling your readers that your experimental design was poor…not ideal!
Moreover, is it even true that if you do more the p will come down? Maybe if the original n is small, but this short article describes some simulations of increasing sample size effect on p values; simply, the implication that increasing sample size would reduce the p isn’t supported.
“It is likely that the use of trend to describe almost significant differences is mostly an innocent error, and that the intention is to imply only that the observed differences, although non-significant, may be worthy of further investigation in subsequent more highly powered studies. This may be an entirely appropriate interpretation, as a negative finding is never proof of ‘no difference’. On the other hand, misuse of trend to describe almost significant differences could be misinterpreted by less informed readers as suggesting a real trend, which would be misleading.”
https://academic.oup.com/bja/article/115/3/337/312358
What about “almost significant”.
Again, nope. Significant is like passing your driving test or a grant being funded. Almost funded is (sadly) the same as not funded. Significant is about whether you reject the null hypothesis there is no ‘almost rejected’ category when P values approach but are slightly greater than the pre-set α.
3. Confidence that populations are the same
P above 0.05 does not mean that the populations are the same, rather that you are not confident that they are different (in a T test, ANOVA etc).
This is a Big point. A standard hypothesis test (T test, ANOVA etc) returns a p value that tells you how confident you can be that an observed difference is not a false positive. It sounds like a subtle distinction but it is an important difference (that many people get wrong).
To be confident in an absence of difference you need to perform equivalence analysis or a non-inferiority test. Equivalence tests are used to report confidence that differences do not exist between two means or between a mean and a target value
Before you can test for equivalence you have to define a range that you consider to be scientifically equivalent (stats cant do this for you, it’s a biological decision).
Simple method: once you have defined the equivalence zone, you can plot your treatments with their confidence intervals relative– if the 95% confidence interval falls within the range defined as equivalent then you can be 90% confident that the populations are not different (example below). If the confidence interval extends beyond that zone then you are not confident.

Formal testing: confidence intervals are easy to grasp, explaining the processes behind formal hypothesis testing becomes a bit more tricky! My message with stats is that you work out what you want to test, then spend some time reading about the options and limitations of the different tests that achieve your goal.
Your standard stats package may or may not have built in test options for non-inferiority. Indeed, your best option might be to plot the confidence intervals. Note that the image above comes from this page which explains things comparatively well. There is also a nice paper here that describes the TOST method here.
In terms of reporting, as your have a confidence measure, you can write the results directly, with no mention of stats required in the sentence. However, as this sort of reporting is somewhat rare, often misreported and because you want to differentiate between equivalence and no statistical difference then I would recommend something like…
A and B were statistically equivalent within limits of X and Y (A mean + 95%CI, B mean + 95%CI)
You should define the range that you considered as equivalent within the sentence.
4- Same but not confident (in terms of equivalence)
In a situation where you have formally tested for equivalence and found that you can’t be confident in the outcome then you are in the same sort of options as when you have a difference that you are not confident in. You write the narrative in a definitive way.
“Observed means of population A and B fell within the equivalence range, however, confidence intervals preclude confidence in equivalence (A mean 95%CI, B mean 95% CI)”
Wow, that’s clunky. Luckily it is rare that you would want to say this! The point is the same as above; you write what was observed in a definitive way!
Conclusions and take away
The title of this post should have been; “Options for describing results where there are interesting observed differences but where the inferential statistics indicate that those observations don’t meet the predefined thresholds for statistical significance.” Not quite as catchy, but more accurate.
Your results matter whatever they are, it is important that you describe them correctly.
Found this useful, here are a few related pages that you might find useful:


3 Comments