
Time for a new series. “You can see a lot by looking” basicaly cool images from our research + a little explanation. Microscopy in its various forms has always been one of my favourite things to do, especially when trying out new modalities that open up opportunities to ask new/deeper questions, so I figured we might as well show off some of our pretty images.
#1 in the series is from today; Lee and I used the new Total Internal Reflection Fluorescence (TIRF) microscope at the University of Liverpool’s Centre for cell imaging. This was the first time we have used this microscope and these are just a couple of a set of really nice images, acquired thanks to the expert help of Dave Mason (@dn_mason).
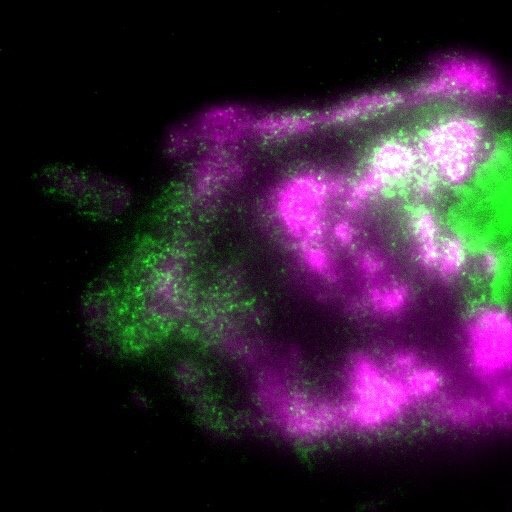
Why is it cool? Well, TIRF is pretty awesome. Basically, whereas normal microscopy involves illuminating the sample directly and then collecting either the transmitted light or the reflected light depending what you are looking for, TIRF involves illuminating the sample at a shallow angle and collecting the light that is internally reflected (the same principle that fibre optics work by). The practical upshot of this is that when you image at the critical angle, you effectively limit the illumination to near the cell substrate boundary, the bottom ~75nm (1/750,000 of a mm!). You can see the difference this makes in the images below; left = TIRF, right = conventional imaging. Without the TIRF it is much harder to see the fine organisation of the protein at the bottom of the cell.


How are we using it? Well in the magenta and green image, we have imaged live corneal epithelial cells where we have induced expression of the LaNt alpha31 protein with a green fluorescent tag and laminin beta3 with a mCherry tag (shown in magenta) and while the whole cell expresses these proteins, we have limited what we are looking at to just the point where the cell is touching the glass. So here, where we see codistribution of signal i.e white, it’s showing the LaNt and the laminin are close together at the bottom of the cell. The green only signal, e.g. on the left middle, is where there is lant but limited laminin or vice versa for the magenta. In the image below, I have split one of our other images into its component parts (left=LaNt, right=laminin), in this cell there is a much closer match up in the patterns of the two proteins. Proximity alone doesn’t mean interaction but these data add to the other pieces of the story that we are building about how these two proteins influence each other. FYI the scale bar in the image below is 10 micrometers, 1/100th of a mm, you are looking at just a small part of one cell)

This ‘scope itself pretty amazing, not only can you do TIRF but also Atomic force microscopy at the same time. Looking forward to the next set of experiments…

5 Comments